02/08/2023
Research: Is buying older cars riskier due to clocking and damages?

Renata Liubertaitė

The age of a vehicle can serve as a revealing indicator of a car’s condition. Naturally, sellers of older cars may turn to deception to fetch a higher price for their worn-out vehicles.
As a used car buyer, it’s crucial to be aware of this correlation between a vehicle's age and the likelihood that it has been clocked or damaged.
To assess the scale of this issue, we analyzed millions of carVertical history reports in 14 European countries – Czechia, Croatia, Estonia, France, Hungary, Slovakia, Italy, Latvia, Lithuania, Poland, United Kingdom, Romania, Serbia, and Spain – revealing how risks of buying a car grow with age.

Need help buying a used car?
Enter a VIN code to learn more about any vehicle!
Research findings
The analysis unveiled a direct connection between the age of a vehicle and the prevalence of odometer tampering as well as past damages:
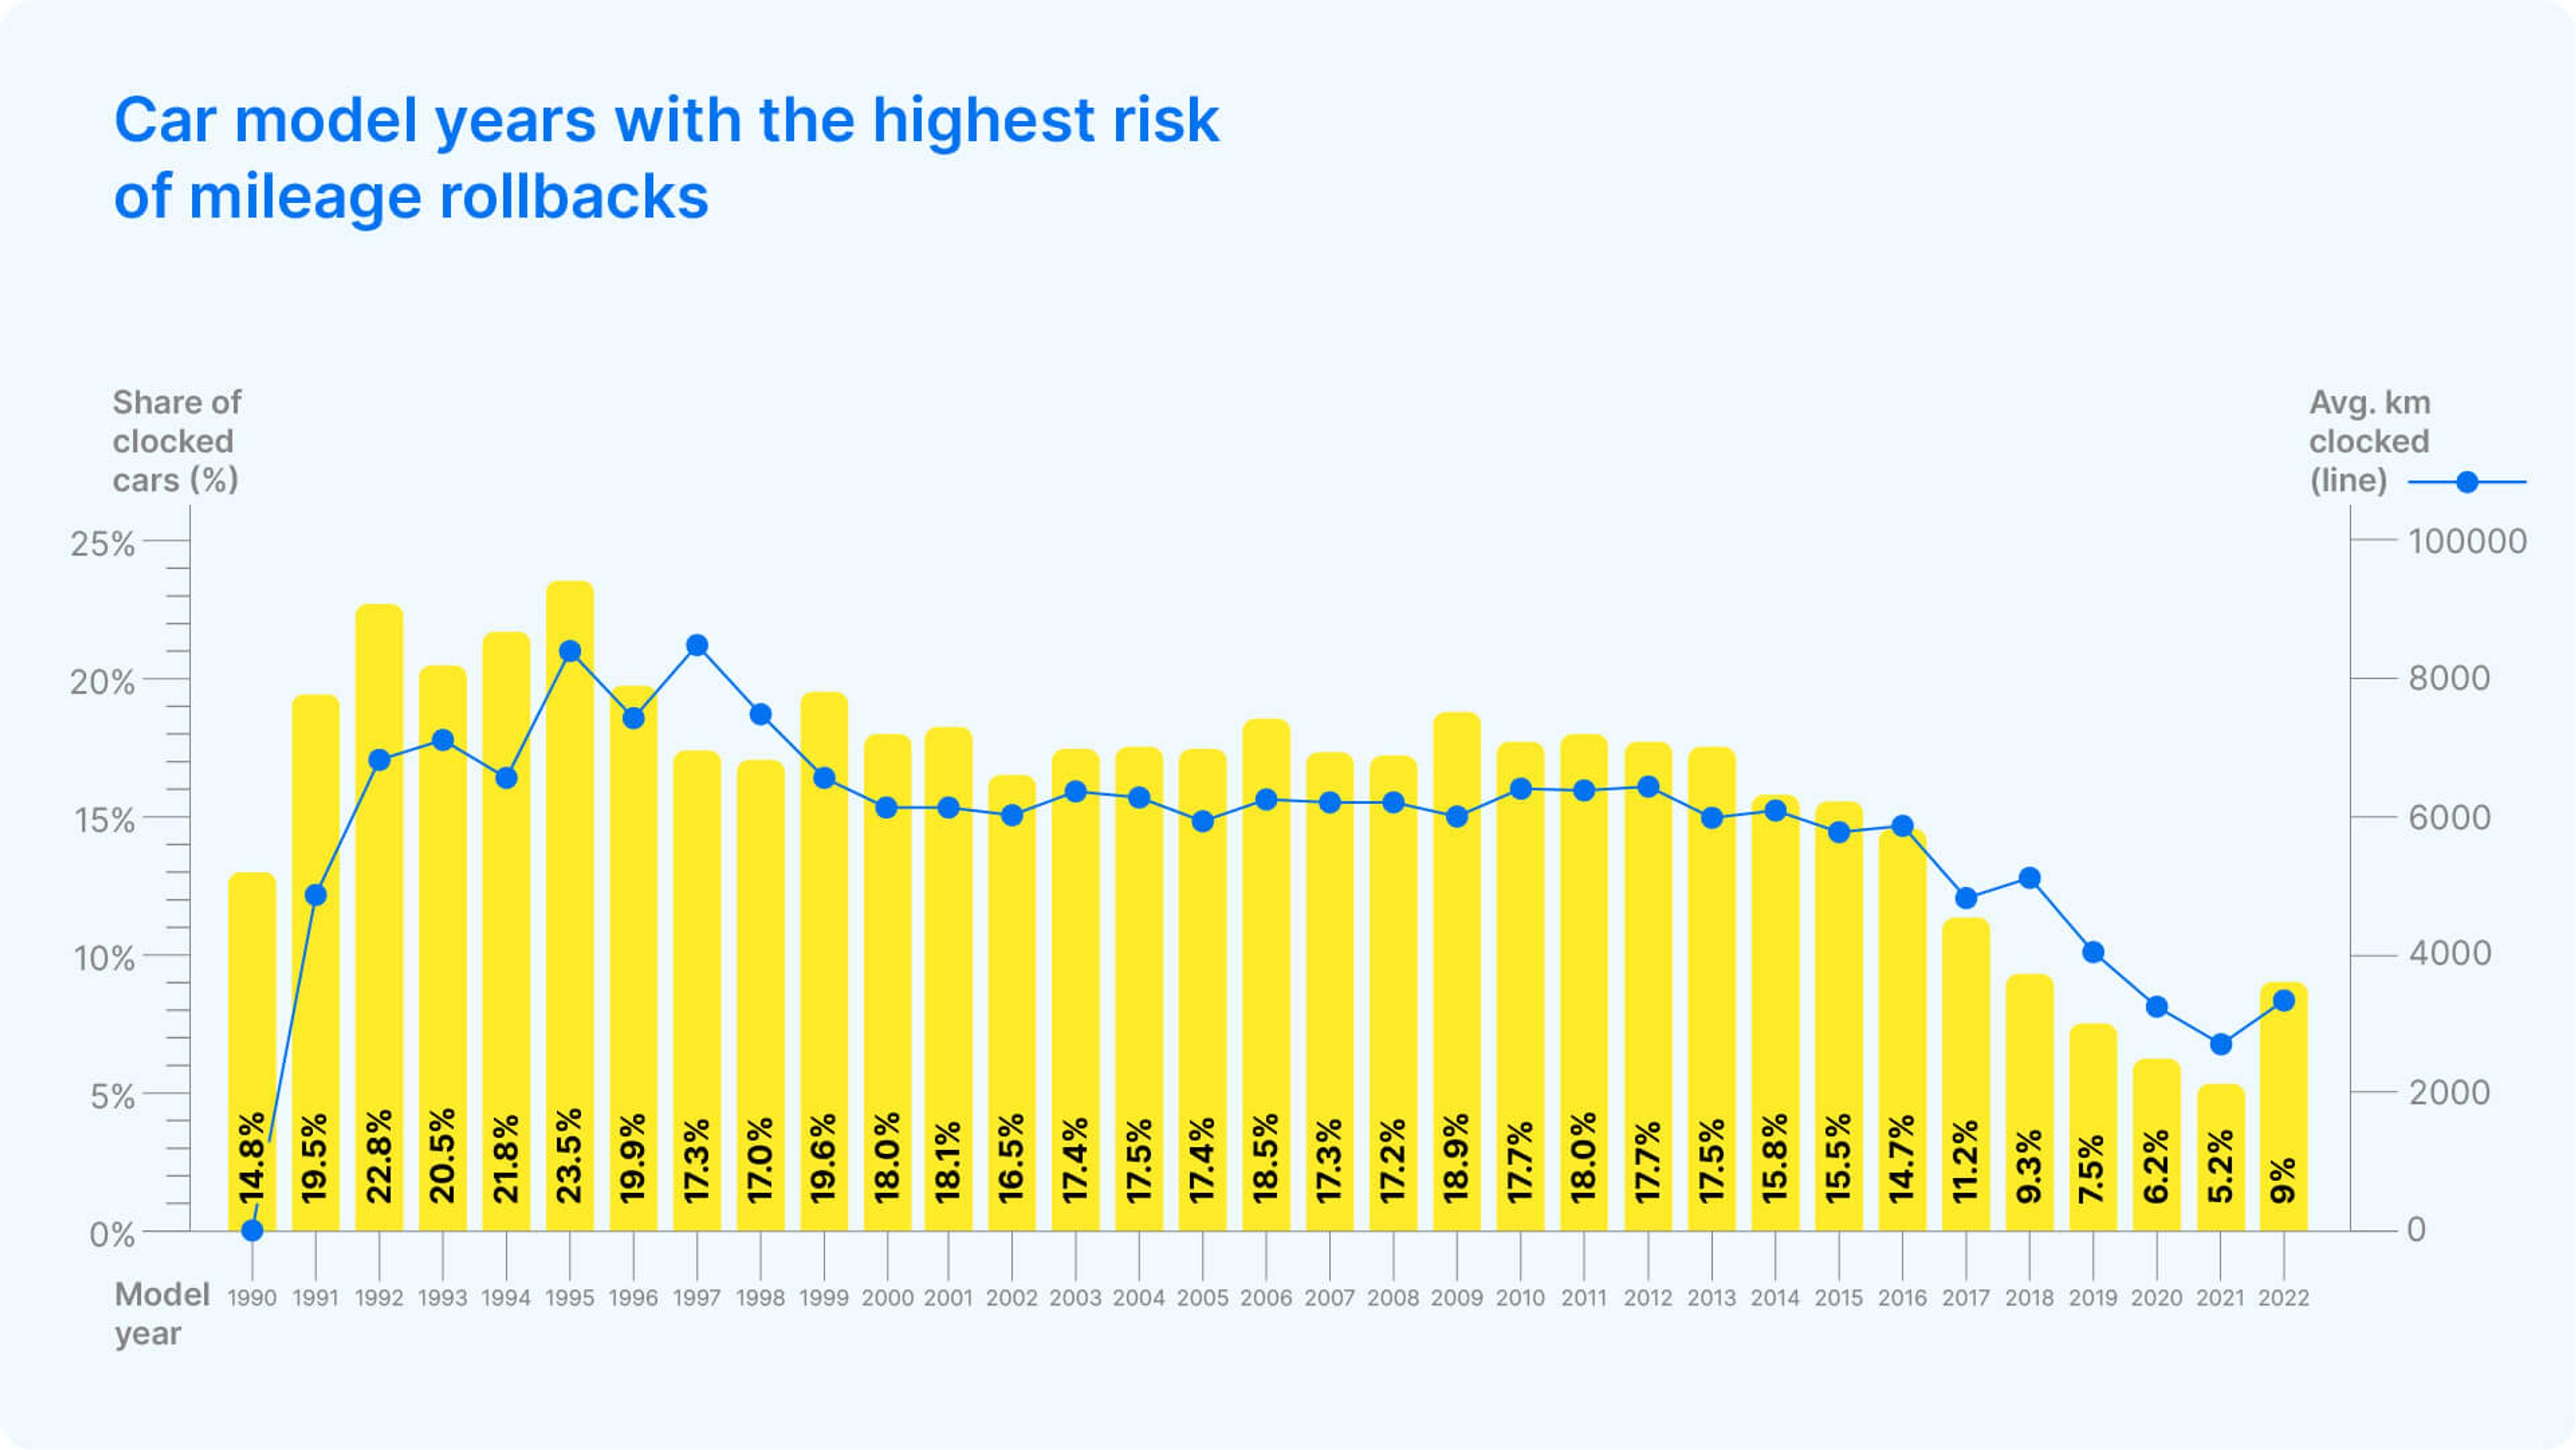
- 28-31-year-old cars are the most likely to be clocked, while newer cars up to 6 years old are much less likely to become victims of mileage fraud.
- The highest number of average clocked kilometers is found among cars between 20 and 30 years old.
- Cars made between 2008 and 2016 have a probability of more than 50% of having been involved in accidents in the past.
- Surprisingly, the oldest vehicles typically have fewer damages recorded; however, this is likely related to different registration practices.
- Drivers are interested in newer cars – according to the research, cars made in 2016 are the most common among buyers, with a share of 8.8% among vehicles checked by carVertical.
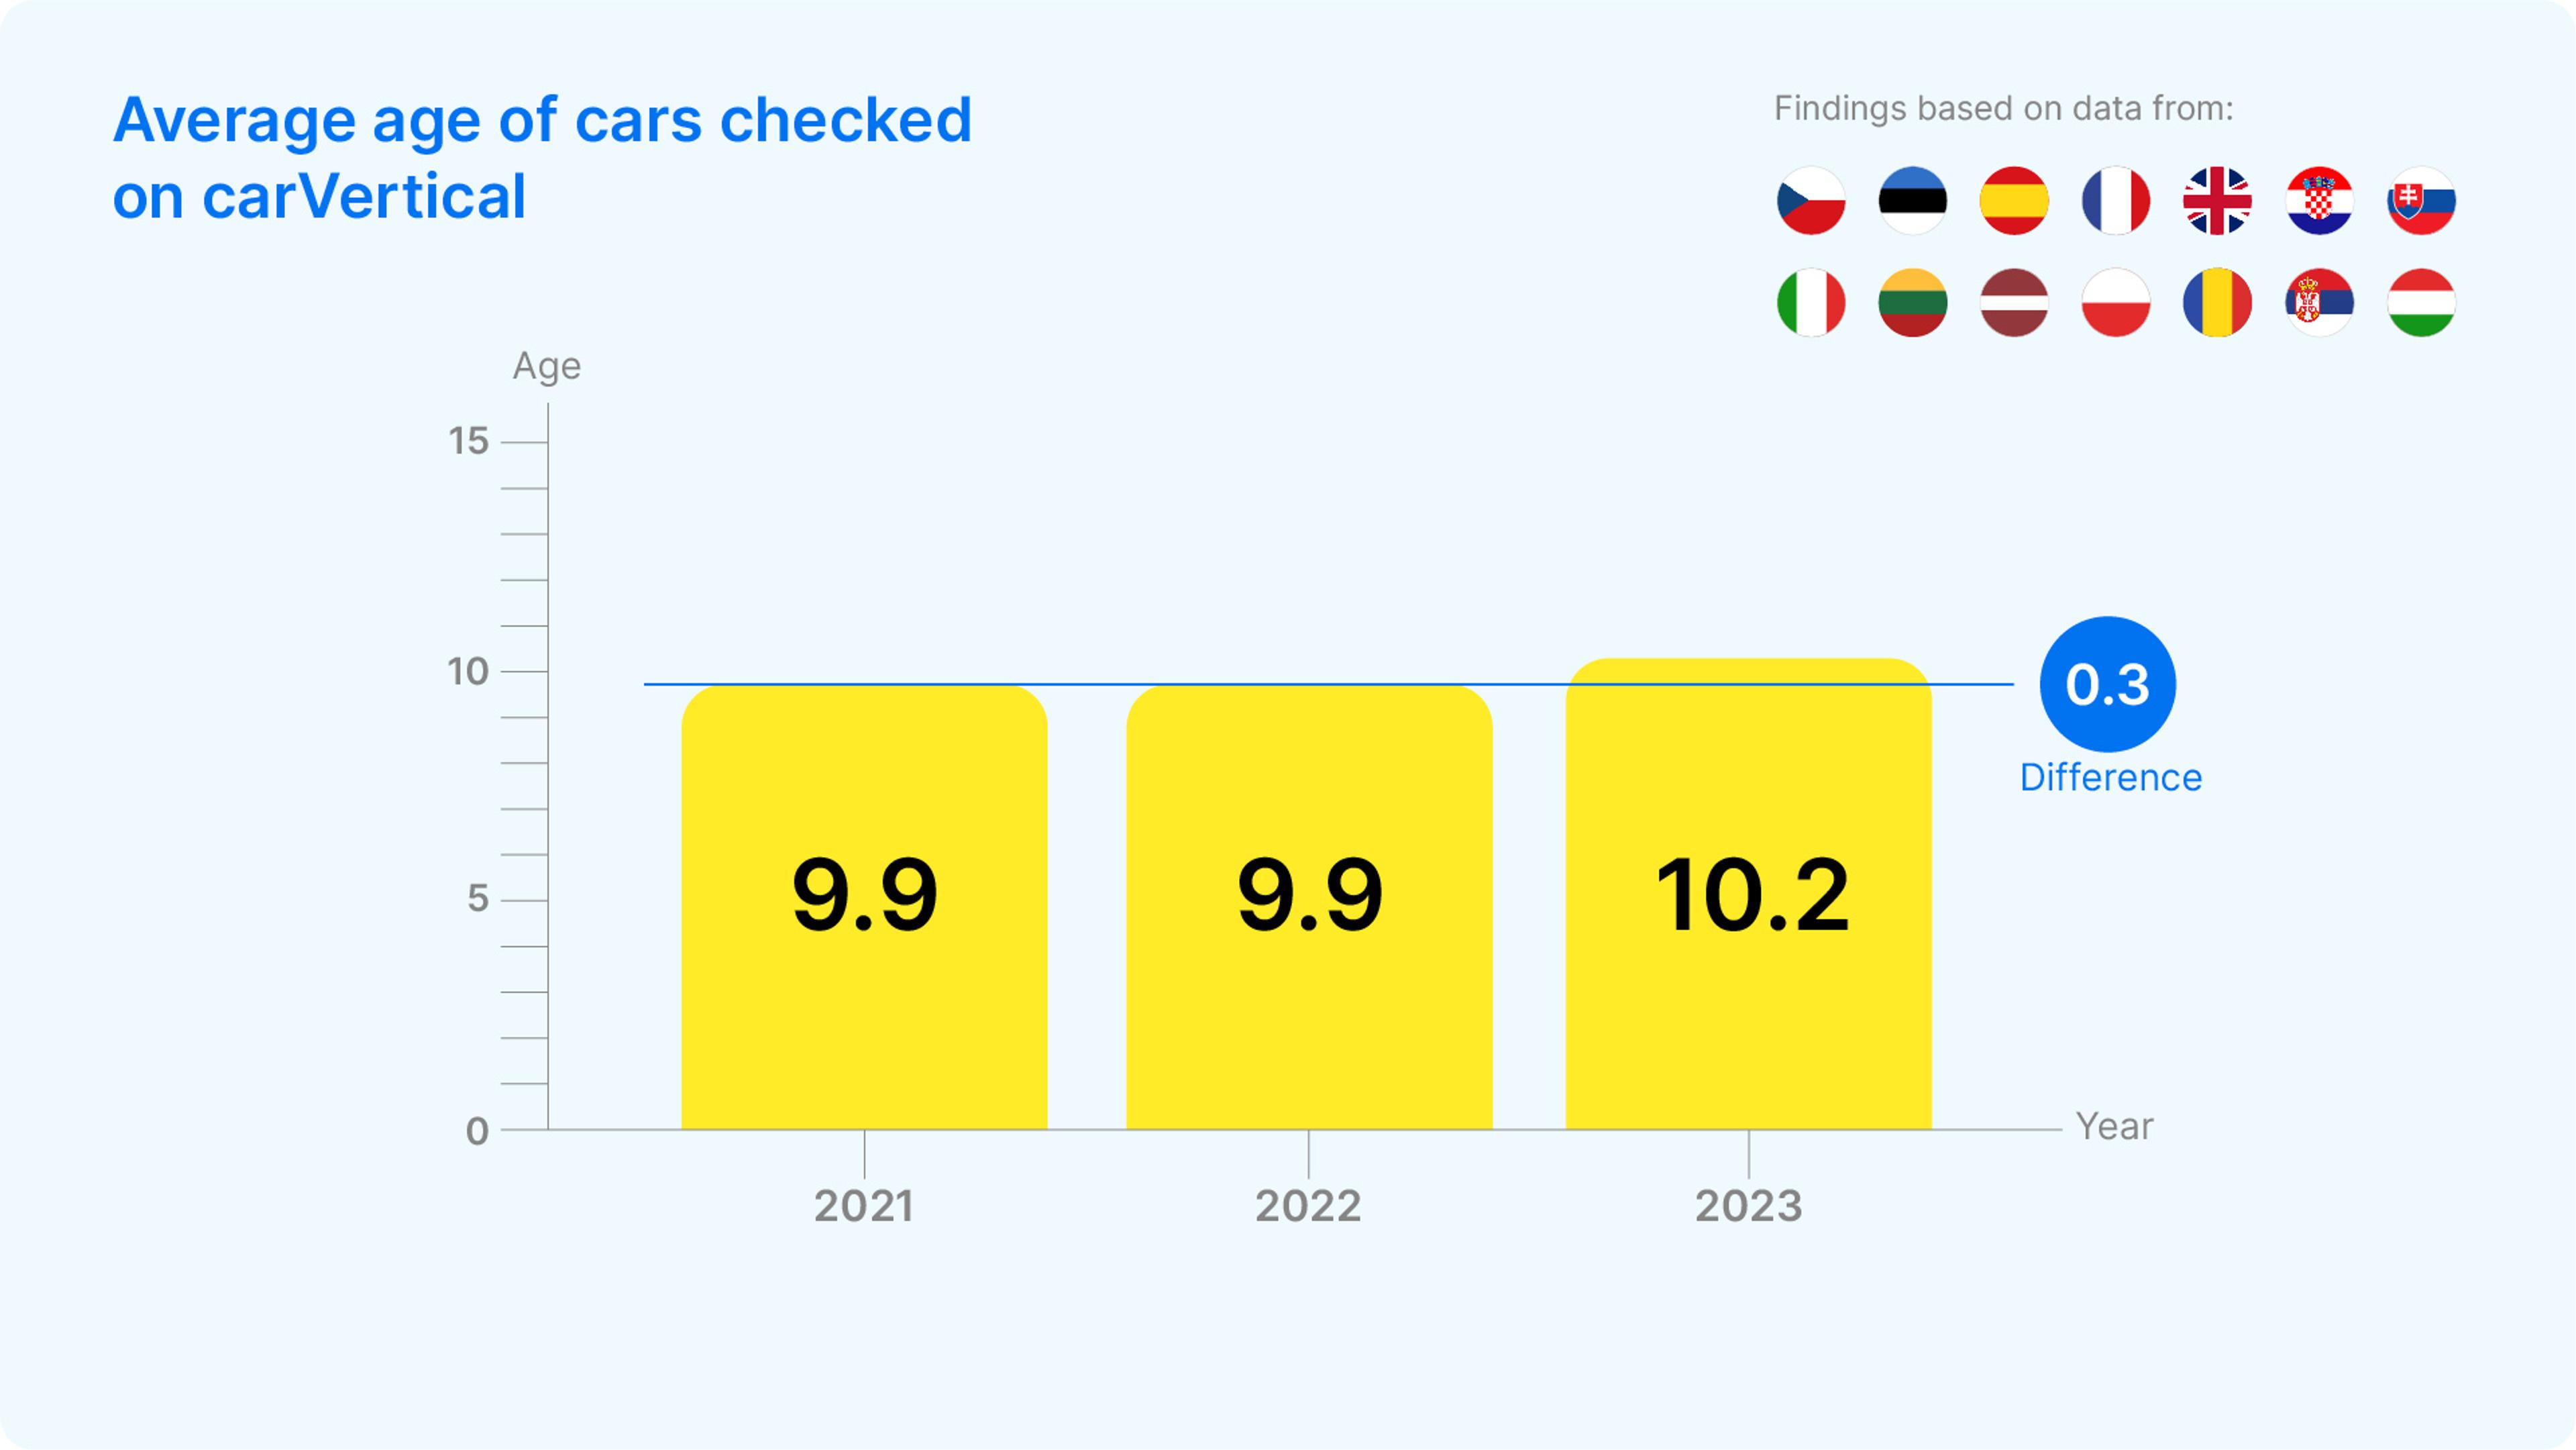
- As of 2023, the average age of cars checked on carVertical is 10.2 years – 0.3 years more compared to 2021 and 2022.
- The largest difference in the checked car age average between countries is only 2.1 years, with Croatians checking the newest cars (9.0 years) and Latvians checking the oldest (11.1 years).
Clocking is more prevalent in older cars
Vehicles between 28 and 31 years old have the highest chances of being clocked. 23.5% of all checked cars built in 1995 had records of mileage rollbacks, followed by 22.8% of those manufactured in 1992, 21.8% in 1994, and 20.5% in 1993.

Naturally, newer cars with a lower mileage are less prone to odometer fraud. The breaking point is vehicles manufactured in 2017 that carry a 3.5% lower risk of being clocked compared to cars made in 2016. Furthermore, "only" 9.3% of vehicles made a year later, in 2018, had mileage rollbacks.
Cars over 20 years old also have the highest number of average clocked kilometers:
- Manufacture year 2001-2011 – 68,256 average clocked kilometers
- 1990-2000 – 77,728 km
- 2012-2022 – 53,416 km

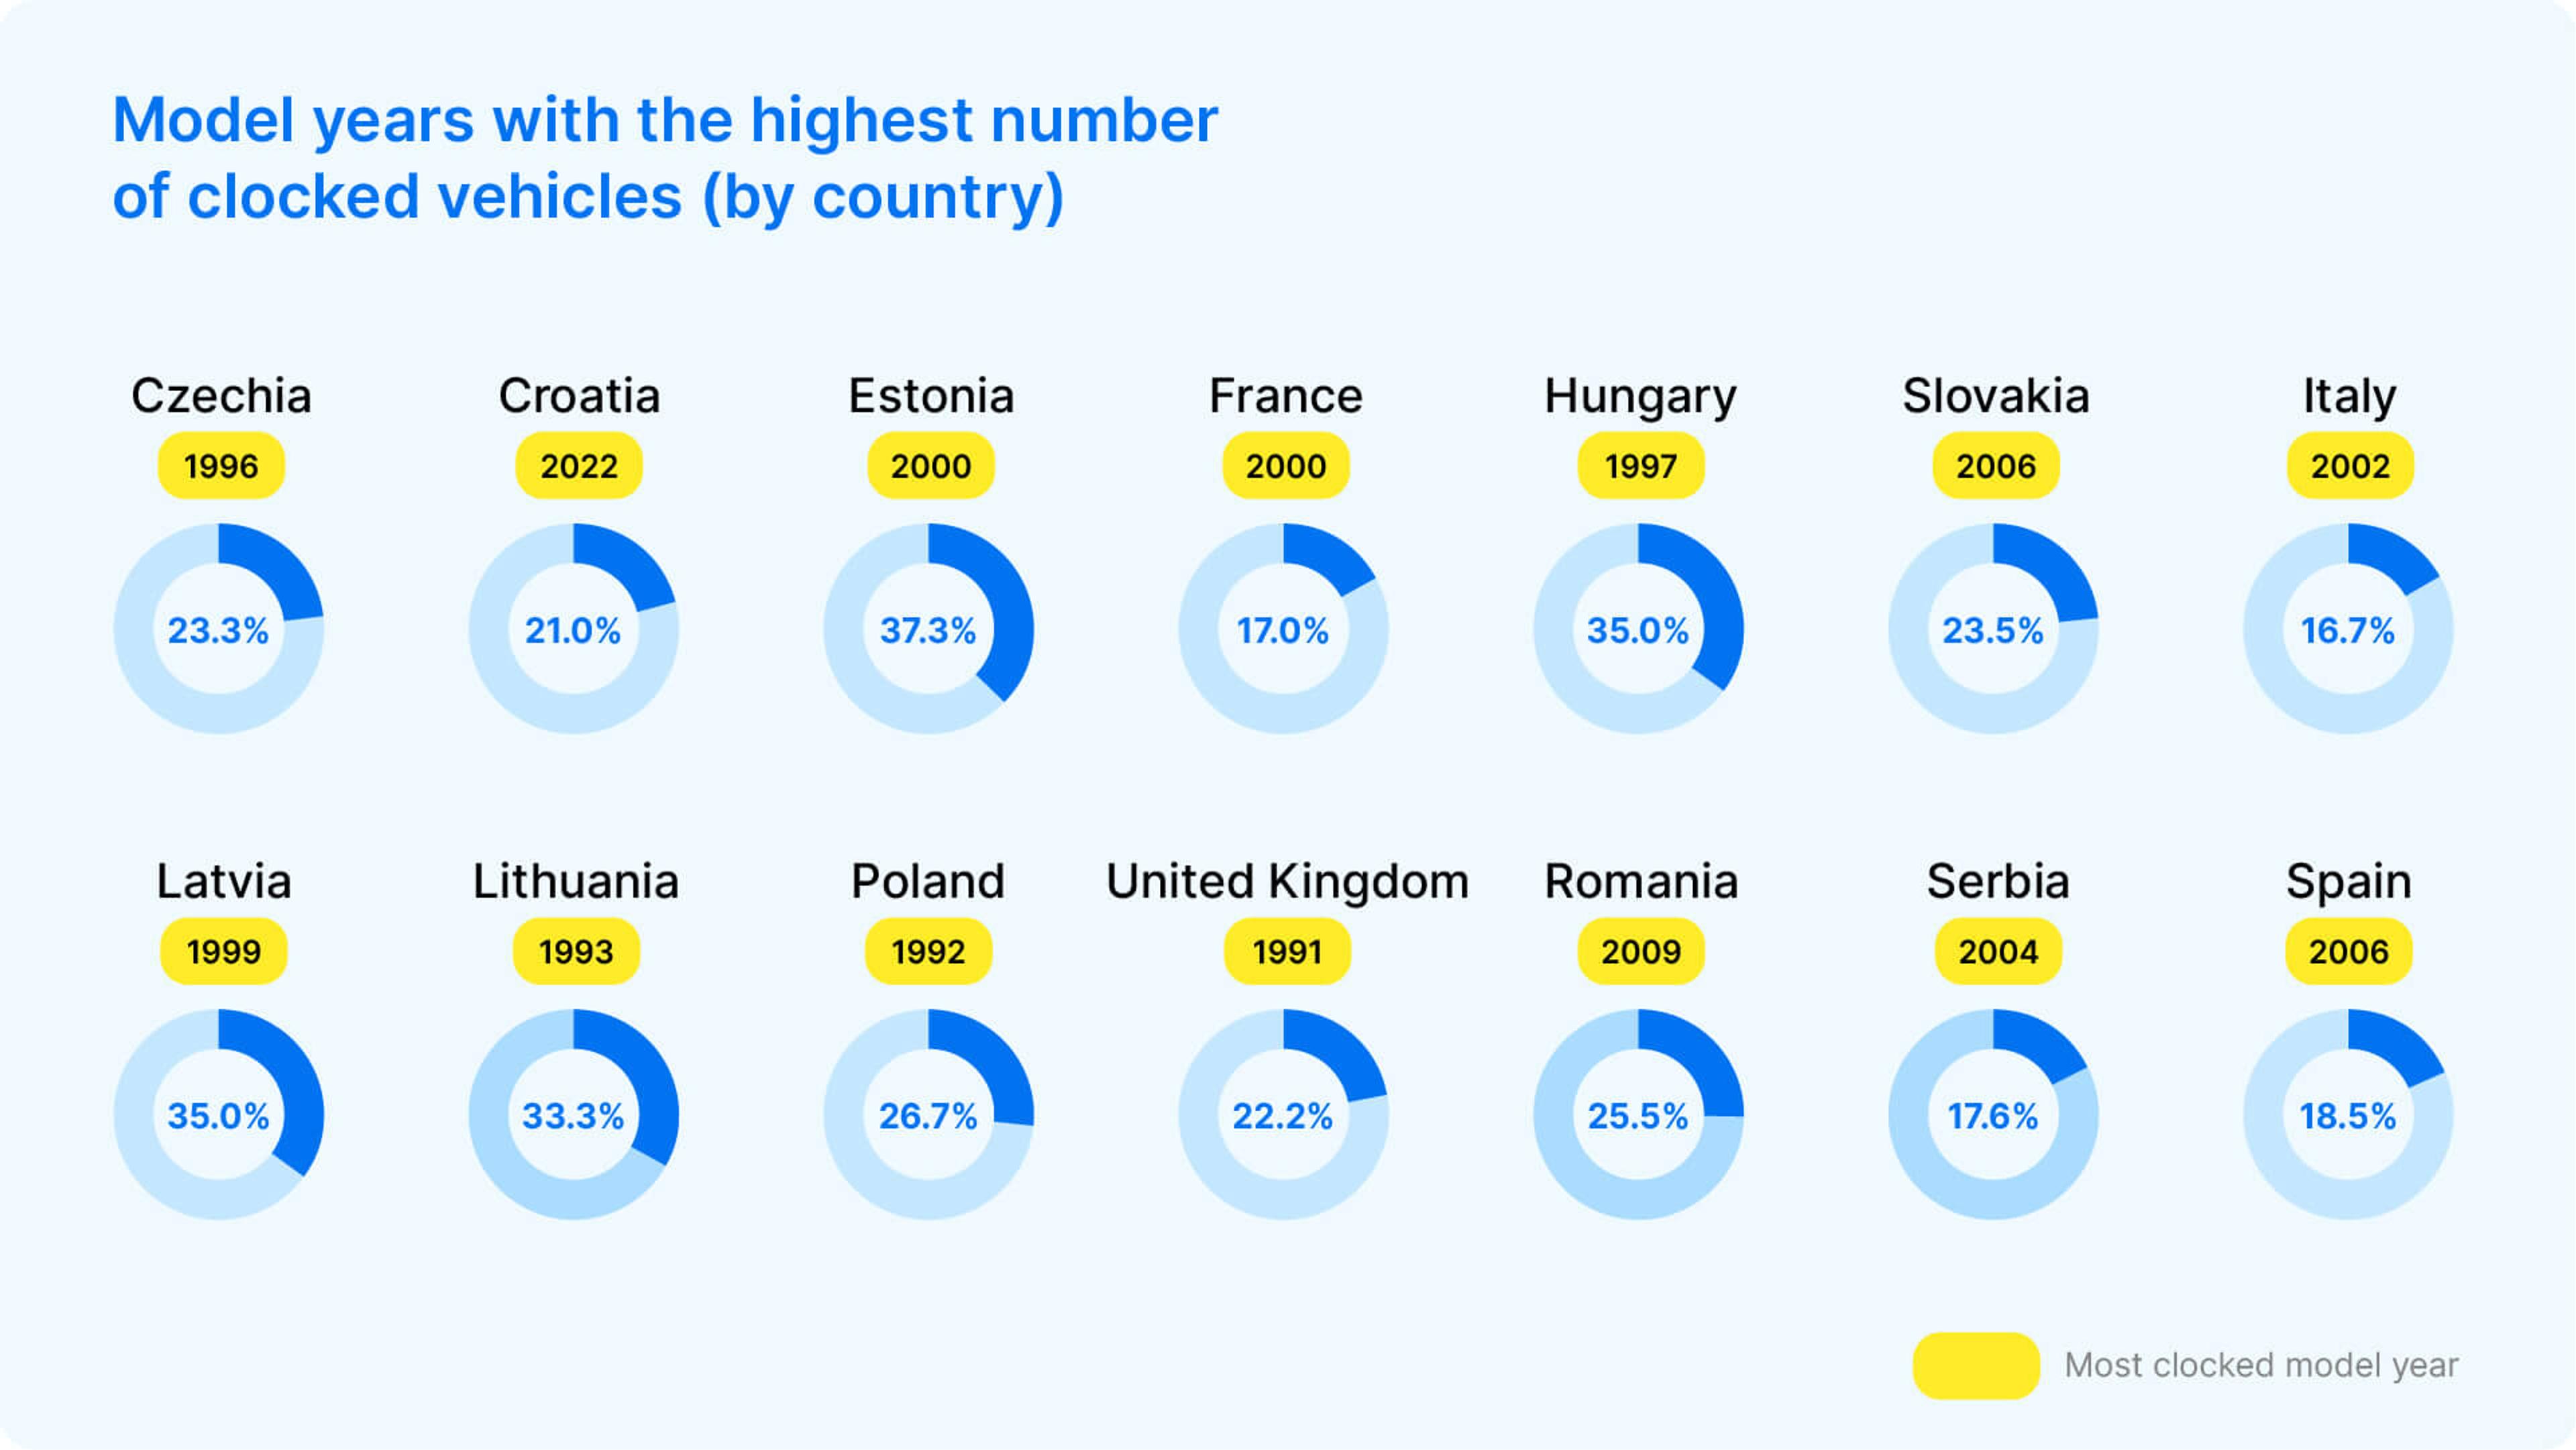
Among selected European countries, Latvia “leads” the clocking race, with 22.2% of cars clocked for an average of 70,242 kilometers. The riskiest model year in this country is 1999 (35% with mileage rollbacks).
Romania (19.5%), Lithuania (18.7%), and Estonia’s (18.3%) results indicate that mileage rollbacks are more prevalent in Eastern and South-Eastern European countries. However, it’s important to note that these countries also have significantly lower numbers of local cars, among which odometer fraud occurs less often.
Every second car has damage records, with vehicles manufactured after 2018 being the safest
According to the research, 49.6% of checked vehicles have damage records. The highest – over 50% – probability of having been involved in accidents exists among cars manufactured between 2008 and 2016.
The breaking point here is vehicles manufactured in 2019 that are 4.6% less likely to have damage records (41.2%) compared to model year 2018 (45.8%).
In selected European countries, the riskiest model years vary, although most damage records are found among cars manufactured (approximately) between 2005 and 2018.
Compared to other selected countries, Poland has the biggest share of total damaged cars – 65.5%, with vehicles built in 2015 holding the most damage records (68.3%). On the other end of the scale, Italy (13.9%) and the UK (18.8%) outperform the rest with the lowest percentage of damaged cars.
Research also shows that the oldest vehicles (over 20 years old) typically have fewer damages recorded. Even though it may seem odd, this is most likely related to different registration practices – some of the older historical records may have been logged in physical documents, not online, which may have significantly impacted the result.
Cars with an average age of 10.2 years are the most common among buyers
Unsurprisingly, drivers are interested in newer cars – vehicles made in 2016 are the most common among buyers, with a share of 8.8%, followed by 2017 – 8.7%, and 2018 – 8.3%.

As of 2023, the average age of cars checked on carVertical is 10.2 years. The most popular age group (2012-2022) accounts for 63.3% of all cars checked on carVertical, while the rest (1990-2011) is at 36.7%.
However, when comparing the buyers’ choices in the last three years (2021-2023), there is a slight increase in the average age of checked cars – +0.3 years (from 9.9 years to 10.2).
Used car buyers are consistent across all 14 countries, where the average age of cars varies from 9 (Croatia) to a little more than 11 years (Latvia). Slovakian (9.1 years) and Italian (9.5 years) drivers tend not to cross the ten years mark when looking for a new-used car.

Somewhat surprisingly, the average ages of checked cars by country don’t always correlate with the average ages of cars seen on the road. For example, according to data from the European Automobile Manufacturers’ Association (ACEA), the average ages of passenger cars in 2020 were:
- 15.3 years in Czechia (+4.9 years)
- 14.8 years in Croatia (+5.8 years)
- 16.7 years in Estonia (+6.1 years)
- 10.3 years in France (+0.2 years)
- 14.2 years in Hungary (+3.4 years)
- 14.3 years in Slovakia (+5.2 years)
- 11.8 years in Italy (+2.3 years)
- 14.3 years in Latvia (+3.2 years)
- 17.0 years in Lithuania (+6.8 years)
- 14.3 years in Poland (+3.4 years)
- 9.4 years in the UK (-0.8 years)
- 16.9 years in Romania (+6.5 years)
- 13.1 years in Spain (+2.8 years)
*No ACEA data available for Serbia.
There is a clear trend in this data: the average age of cars on the road in Central/Eastern European countries is significantly higher than the average age of cars checked by carVertical in these countries. Meanwhile, this difference is much less pronounced or even non-existent in Western Europe (France, Italy, UK, Spain).
We can speculate the reasons for this trend:
- The spending power of buyers in Central and Eastern Europe has seen a significant increase in recent years, allowing the purchase of newer vehicles.
- Policies in Western Europe aimed at reducing CO2 emissions have meant that vehicles are quicker to enter the second-hand market (thus reducing the average age of imported vehicles in Central and Eastern Europe).
Methodology
To show the correlation between the age of the car and the rate of clocking and accident history, we analyzed carVertical vehicle history reports generated by our users in 14 European countries – Czechia, Croatia, Estonia, France, Hungary, Slovakia, Italy, Latvia, Lithuania, Poland, United Kingdom, Romania, Serbia, and Spain.
The data used in this research allows us to prove the hypothesis of potentially higher risks when buying older cars.
Avoiding clocked and damaged cars with carVertical
Getting a vehicle history report is one of the easiest ways to avoid cars with concealed damages and mileage rollbacks. For instance, a carVertical report can provide valuable information about the car’s past, including odometer readings, accident history, title information, service and maintenance records, ownership history, and more.

To get such a report, you only need to enter a vehicle’s VIN number into our VIN decoder. Typically, you will find the VIN on the dashboard (visible through the windshield on the driver’s side), on the driver’s side door jamb, or on the vehicle’s documentation.
This way, you’ll be able to identify potential hidden issues that may not be immediately apparent during a physical inspection, likely avoiding a financial disaster in the future.

Check your registration number
Avoid costly problems by checking a vehicle's history. Get a report instantly!

Article by
Renata Liubertaitė
Renata is a writer with over 8 years of experience in publishing, marketing, and SaaS companies. Writing in various fields and covering highly technical topics has taught her to turn complex things into something everyone can understand. When not writing for carVertical, she loves DIY projects and spontaneous bike rides.
