17/09/2024
carVertical data sources: How history reports are created

Tadas Švenčionis

Clients and business partners often ask us: how are carVertical vehicle history reports created? Where does the data come from?
These questions are understandable – car history reports can turn up some truly unexpected information. Not too long ago, car buyers had to rely on the honesty of sellers and their mechanic’s expertise to get a decent used car.
Well, as much as we’d like to have magical powers, the truth is simpler and more interesting. In this article, we’ll look at how carVertical reports are made.
Afraid of buying a wreck?
Check any VIN to learn a vehicle's history!
The VIN: the key to unlocking your vehicle’s history
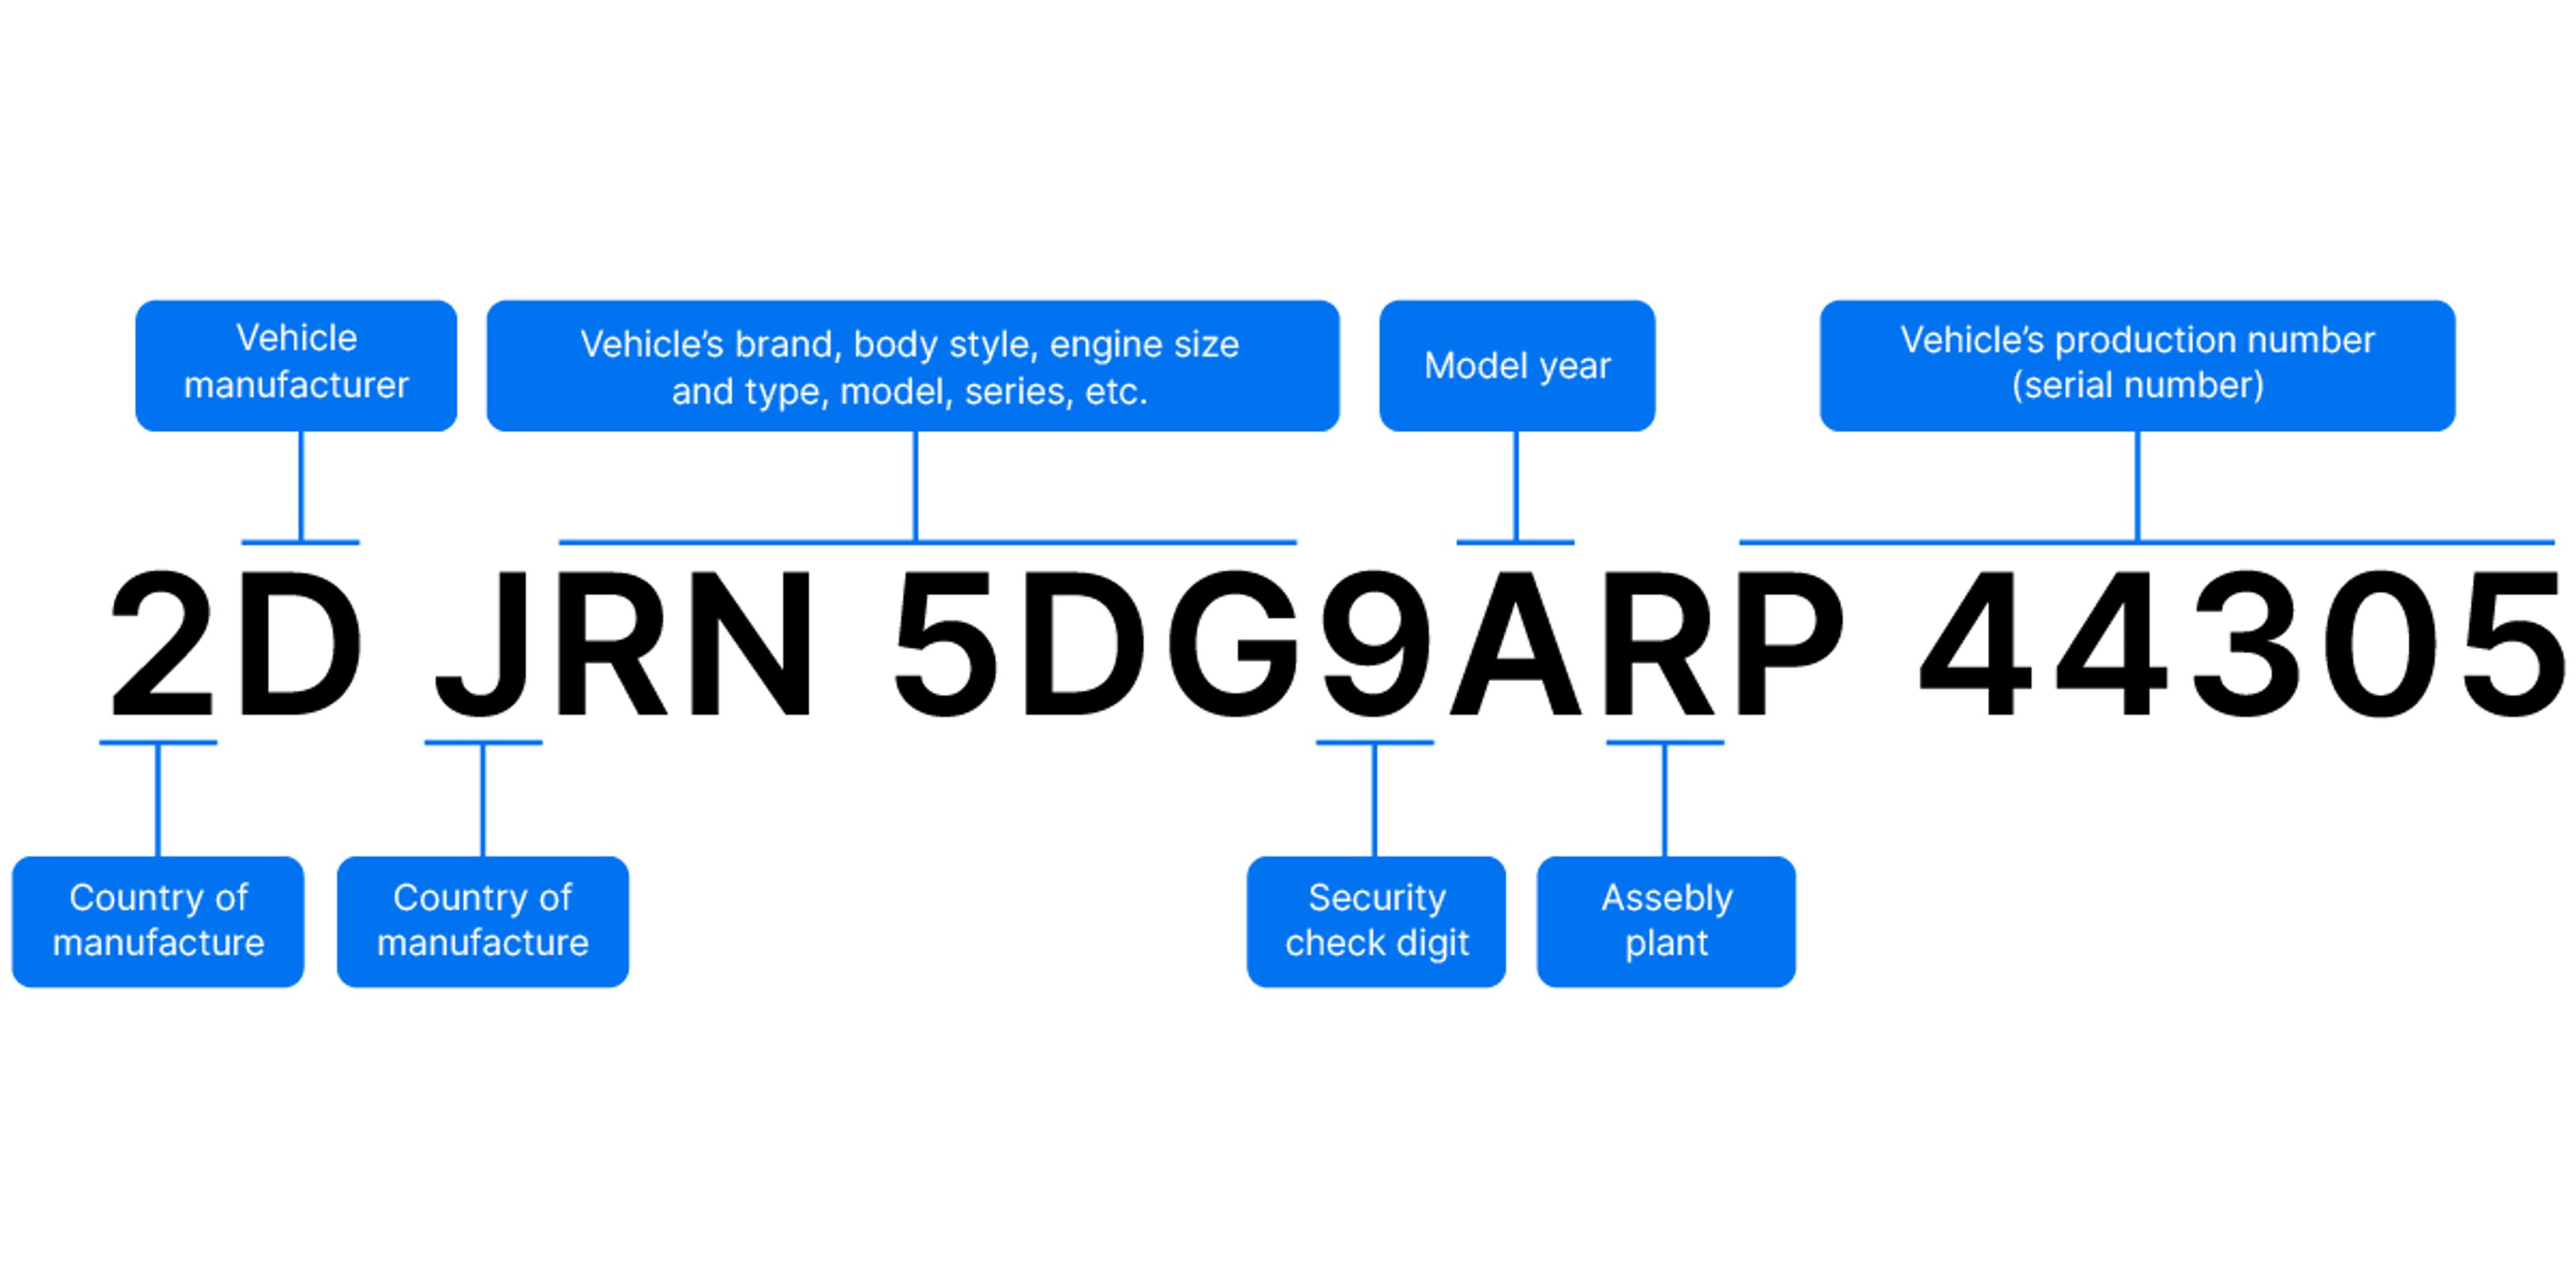
Most carVertical reports start with a Vehicle Identification Number (VIN). So what is it and how does it help us?
Almost every car manufactured after 1981 has a unique 17-character VIN, which acts as the vehicle’s fingerprint. The VIN is used by various institutions – like the police, insurance companies, and service centers – to record major events in a car’s life. Accidents, thefts, mileage checks, ownership changes, and much more are logged with this number.
Because we live in a digital age, most of this data is stored in open and private databases. The VIN is our key to getting that data.
How carVertical reports are created: a behind-the-scenes look
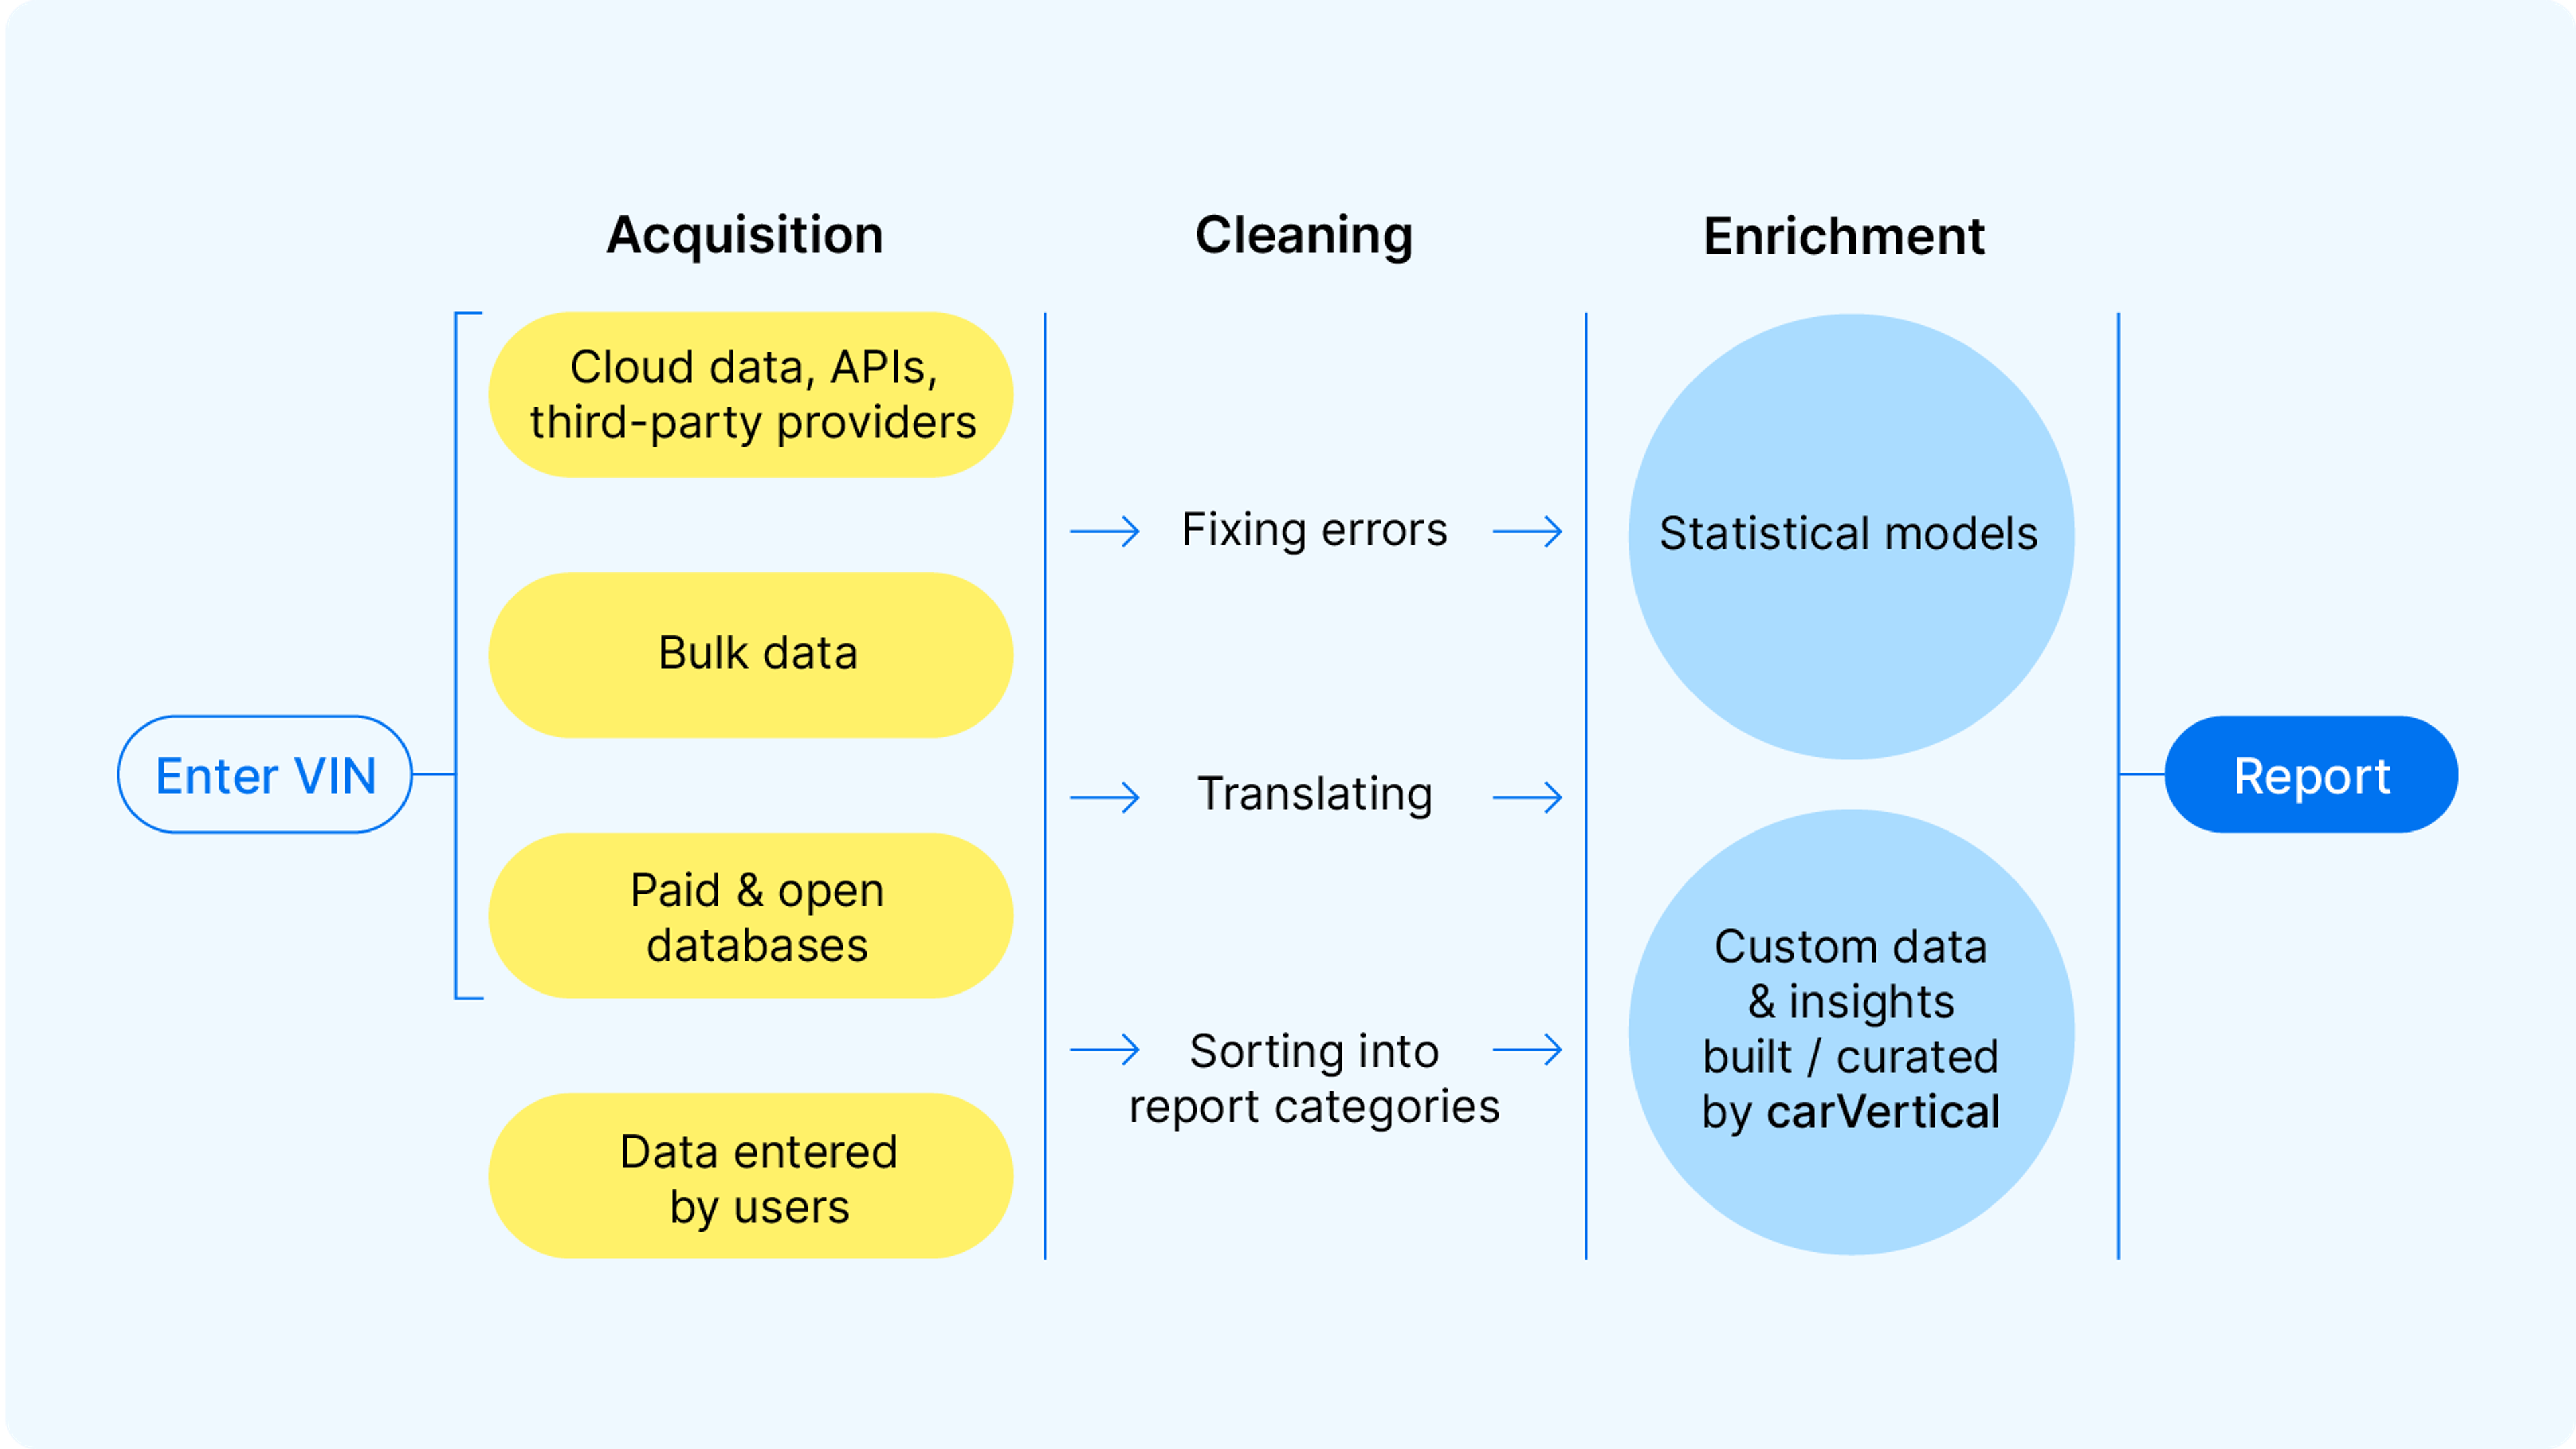
While the report is simple and easy to understand, the technical process behind it is complex, dynamic, and always evolving. Here’s a look at how we turn raw data into clear, actionable insights for you.
1. Using the VIN to search for data
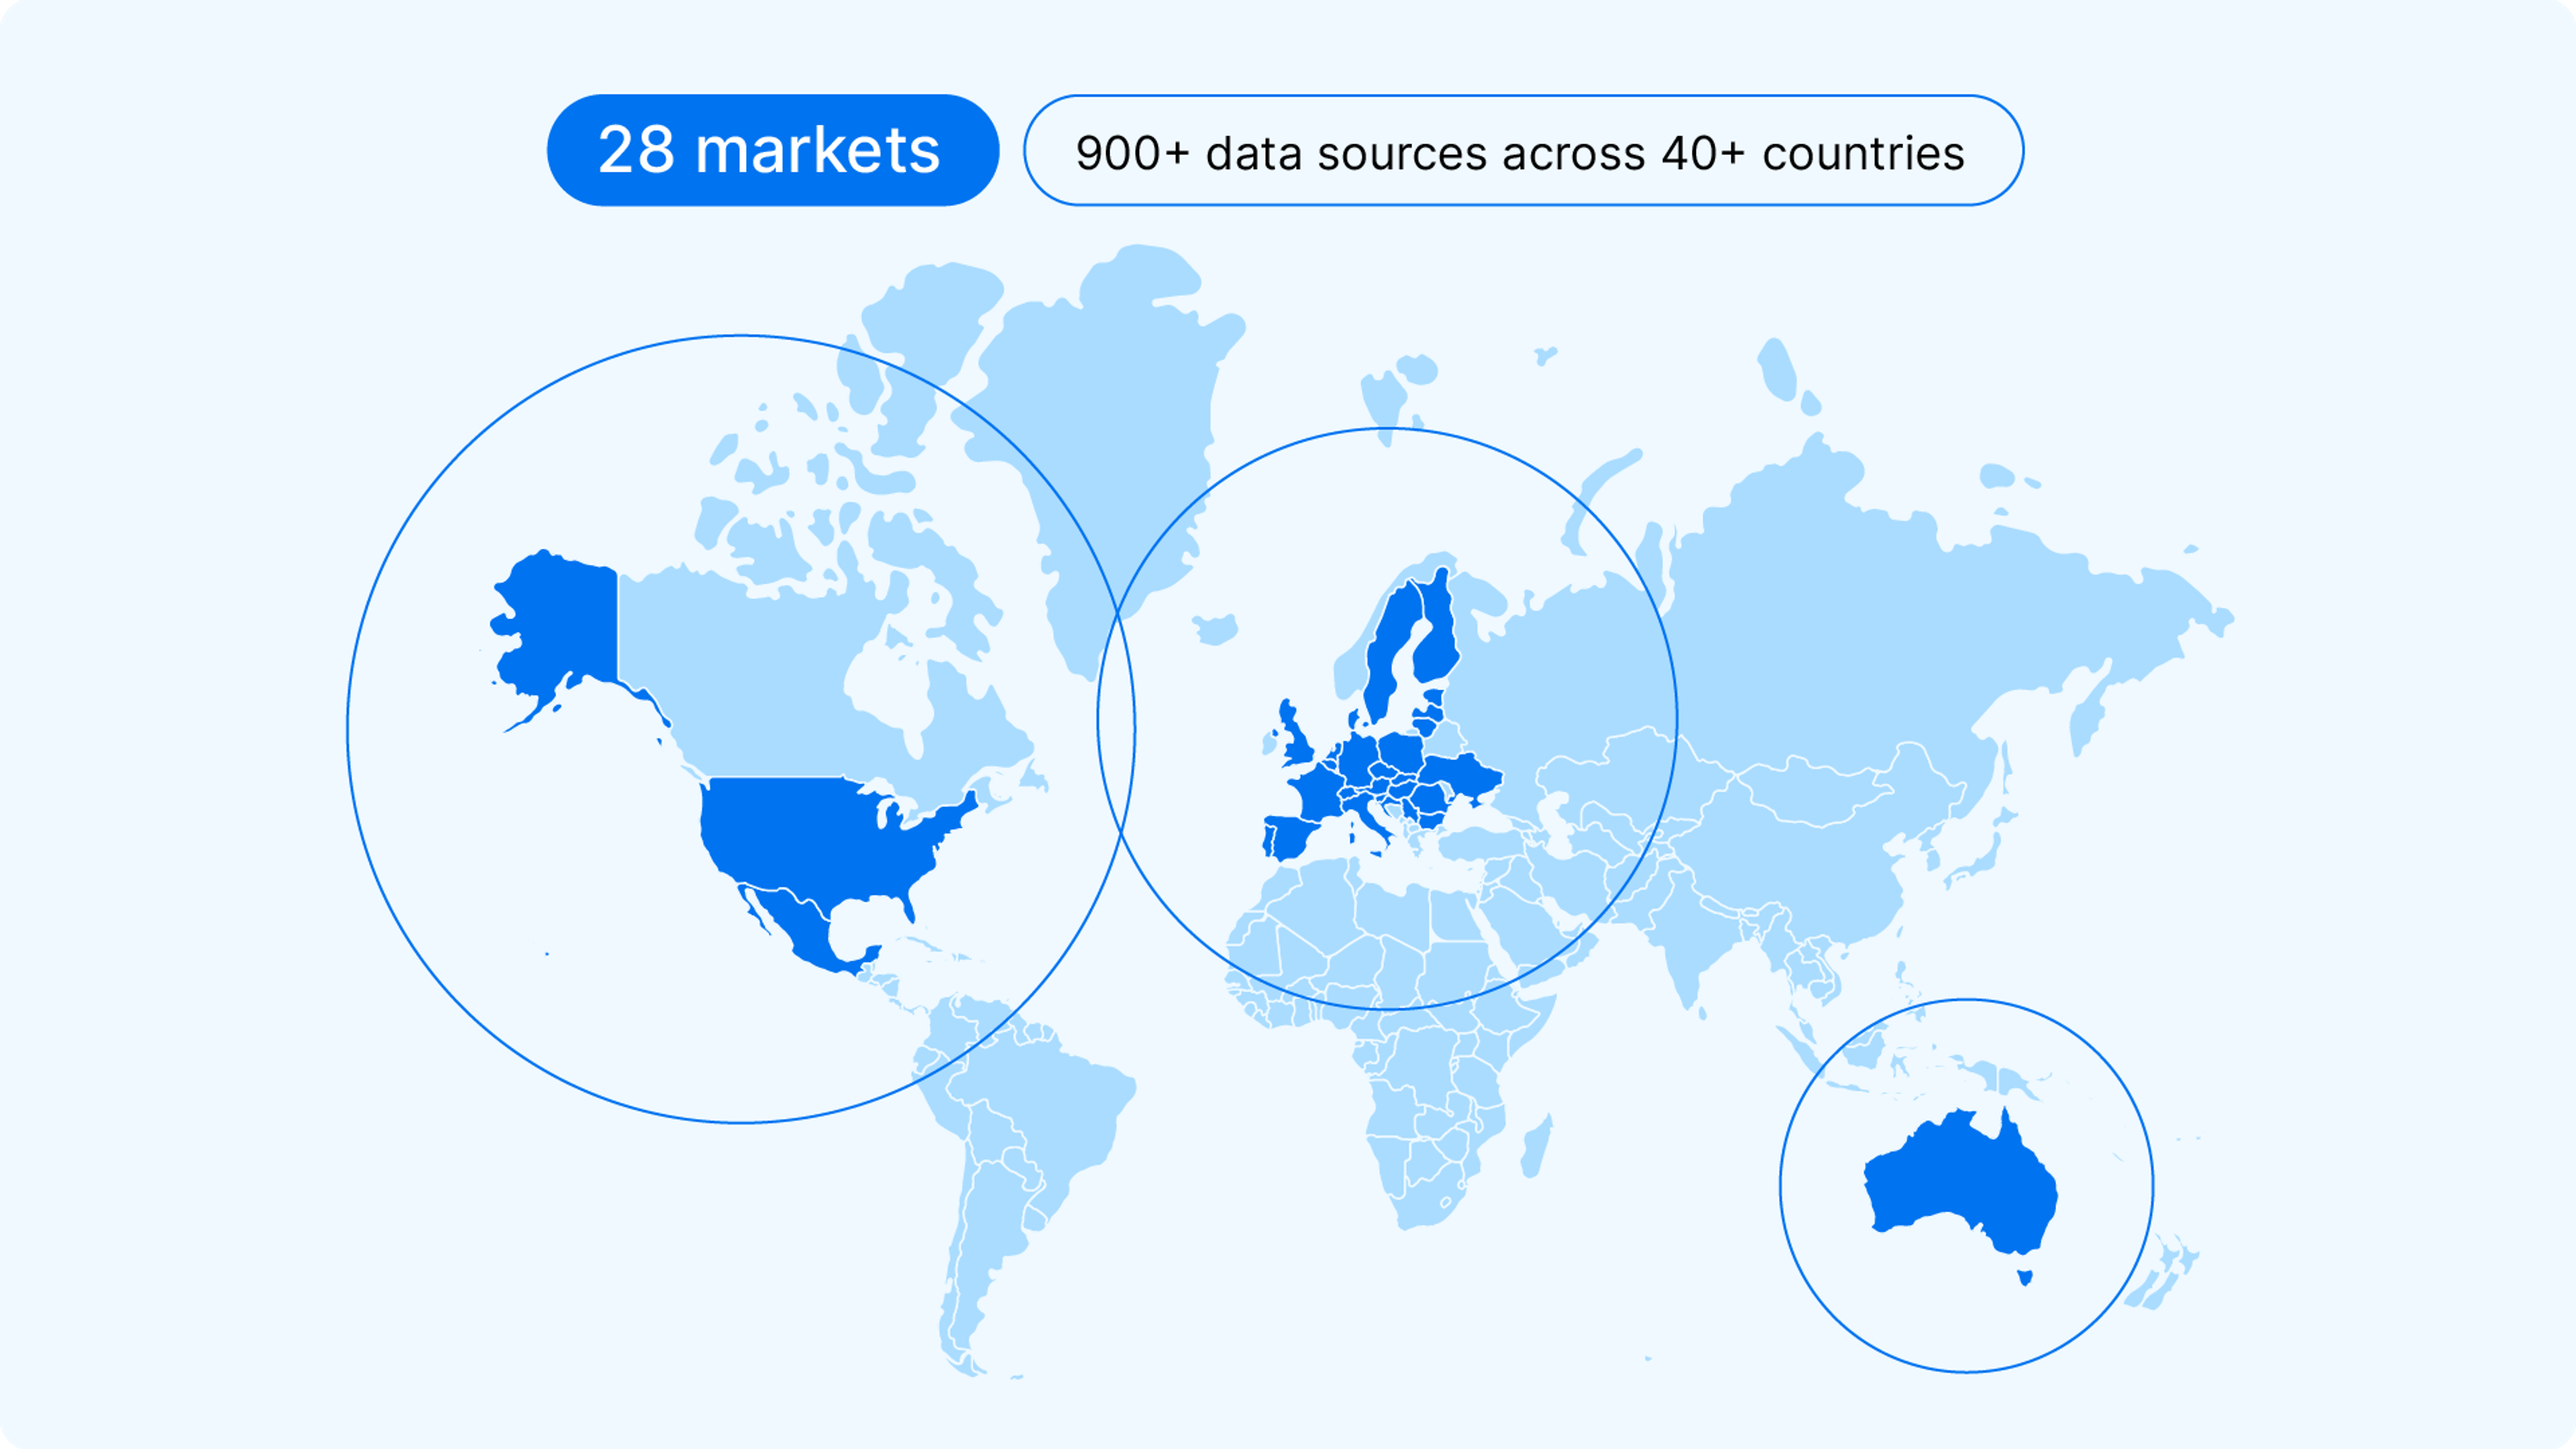
When you enter the VIN on the carVertical app or website, we automatically search through over 900 data sources across 40+ countries. This includes:
- Law enforcement
- National police databases
- Financial institutions
- National / state registries
- Classifieds
- Non profit organizations
2. Cleaning the data and sorting it into usable pieces
The data we receive from various sources is typically raw and requires several steps of processing. Let’s use an example to illustrate this procedure:
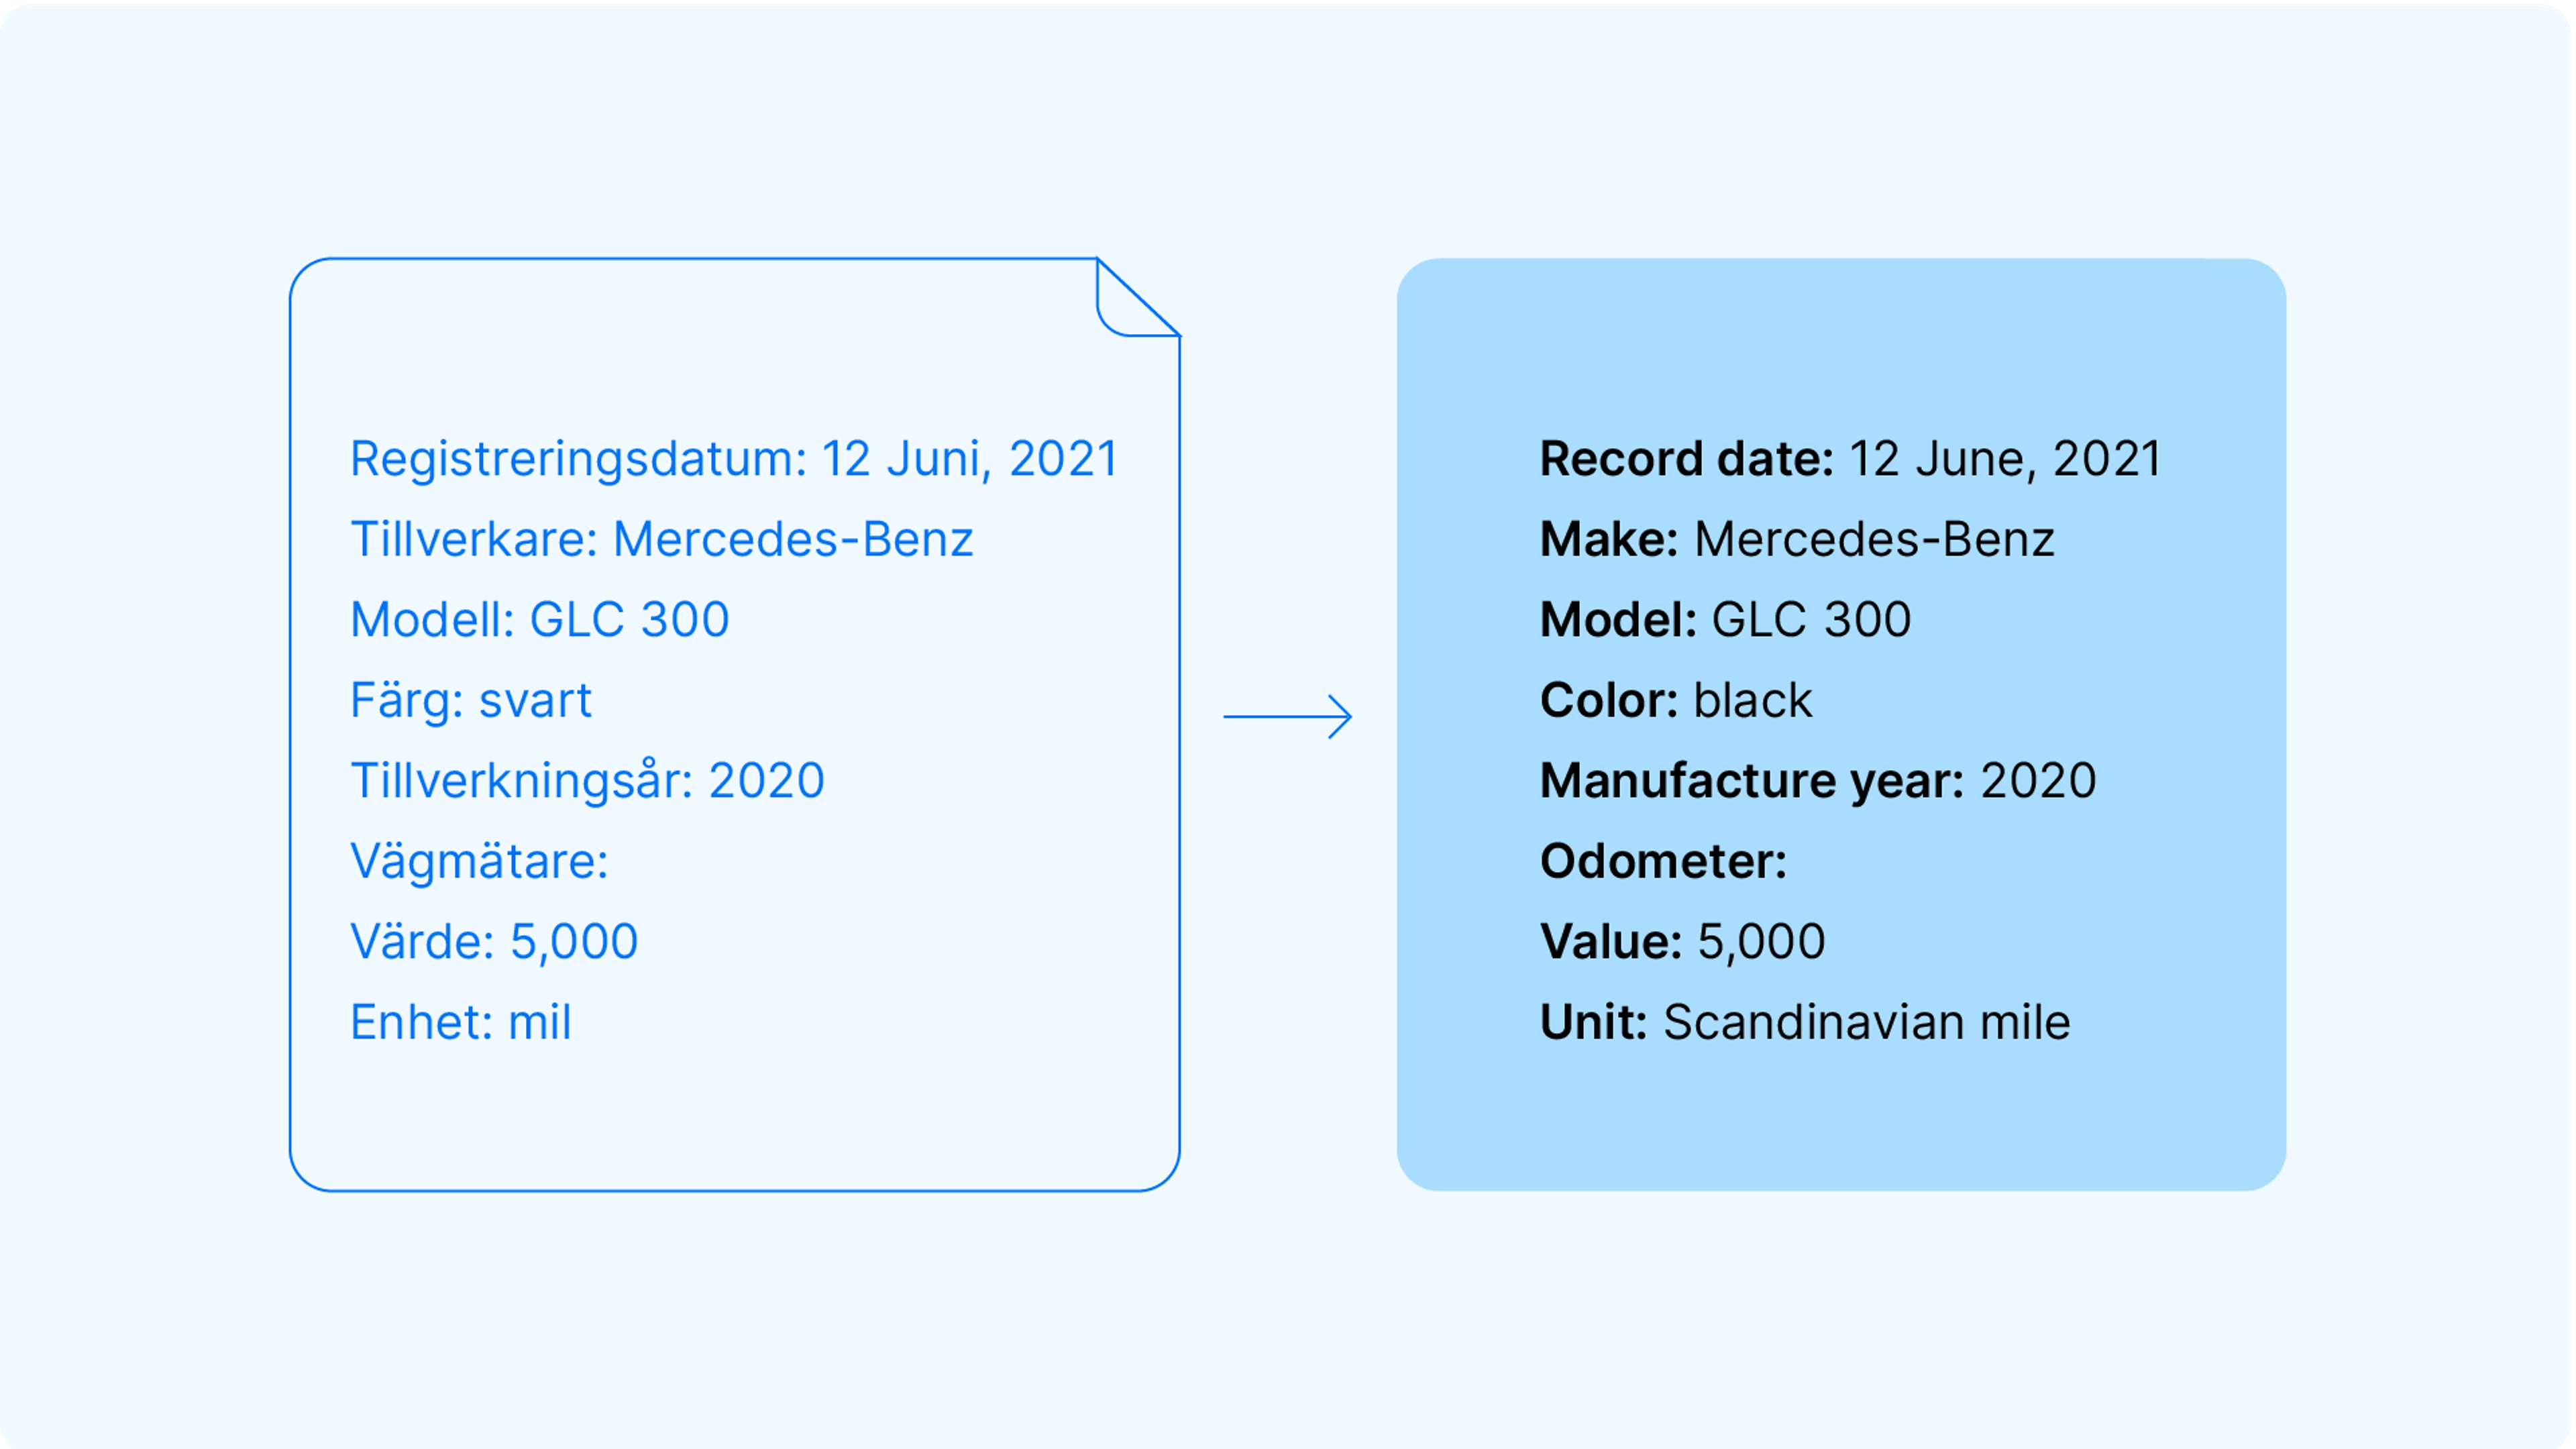
Imagine we receive a Swedish document for a black Mercedes-Benz GLC 300 with 5,000 Scandinavian miles (50,000 km) on the odometer, dated June 12, 2021. Before we can use this information, we need to:
- Fix any errors/inconsistencies. Data is often manually entered into systems, leading to typos or other mistakes.
- Translate the data, if necessary.
- Sort the information into relevant categories, such as:
- Record date: 12 June, 2021
- Country: Sweden
- Manufacture year: 2020
- Make: Mercedes-Benz
- Model: GLC 300
- Color: Black
- Odometer value: 5,000
- Odometer unit: Scandinavian miles
We can now group this data with info from other found records, and use it to generate the report.
3. Assigning the sorted out pieces of data to relevant report sections
To have a closer look at how data becomes a part of the carVertical report, let’s take the same black Mercedes.
We know from the above document that it had 50,000 km on the odometer at the time this information was recorded.
The reason “we” (meaning, the carVertical system) knows this is because we’ve analyzed the document and isolated these 3 pieces of information – “Odometer value: 5,000,” “Odometer unit: Scandinavian miles,” and “Record date: 12 June, 2021.”
Now let’s imagine we’ve found 2 more data records on this Mercedes, offering the following information:
- Document #1:
- Record country: Sweden
- Odometer: 187,000 km
- Registry date: 20 October, 2022
- Document #2:
- Record country: Finland
- Technical inspection date: 7 September, 2023
- Odometer: 105,000 km
- CO2 emissions: [x g/km]
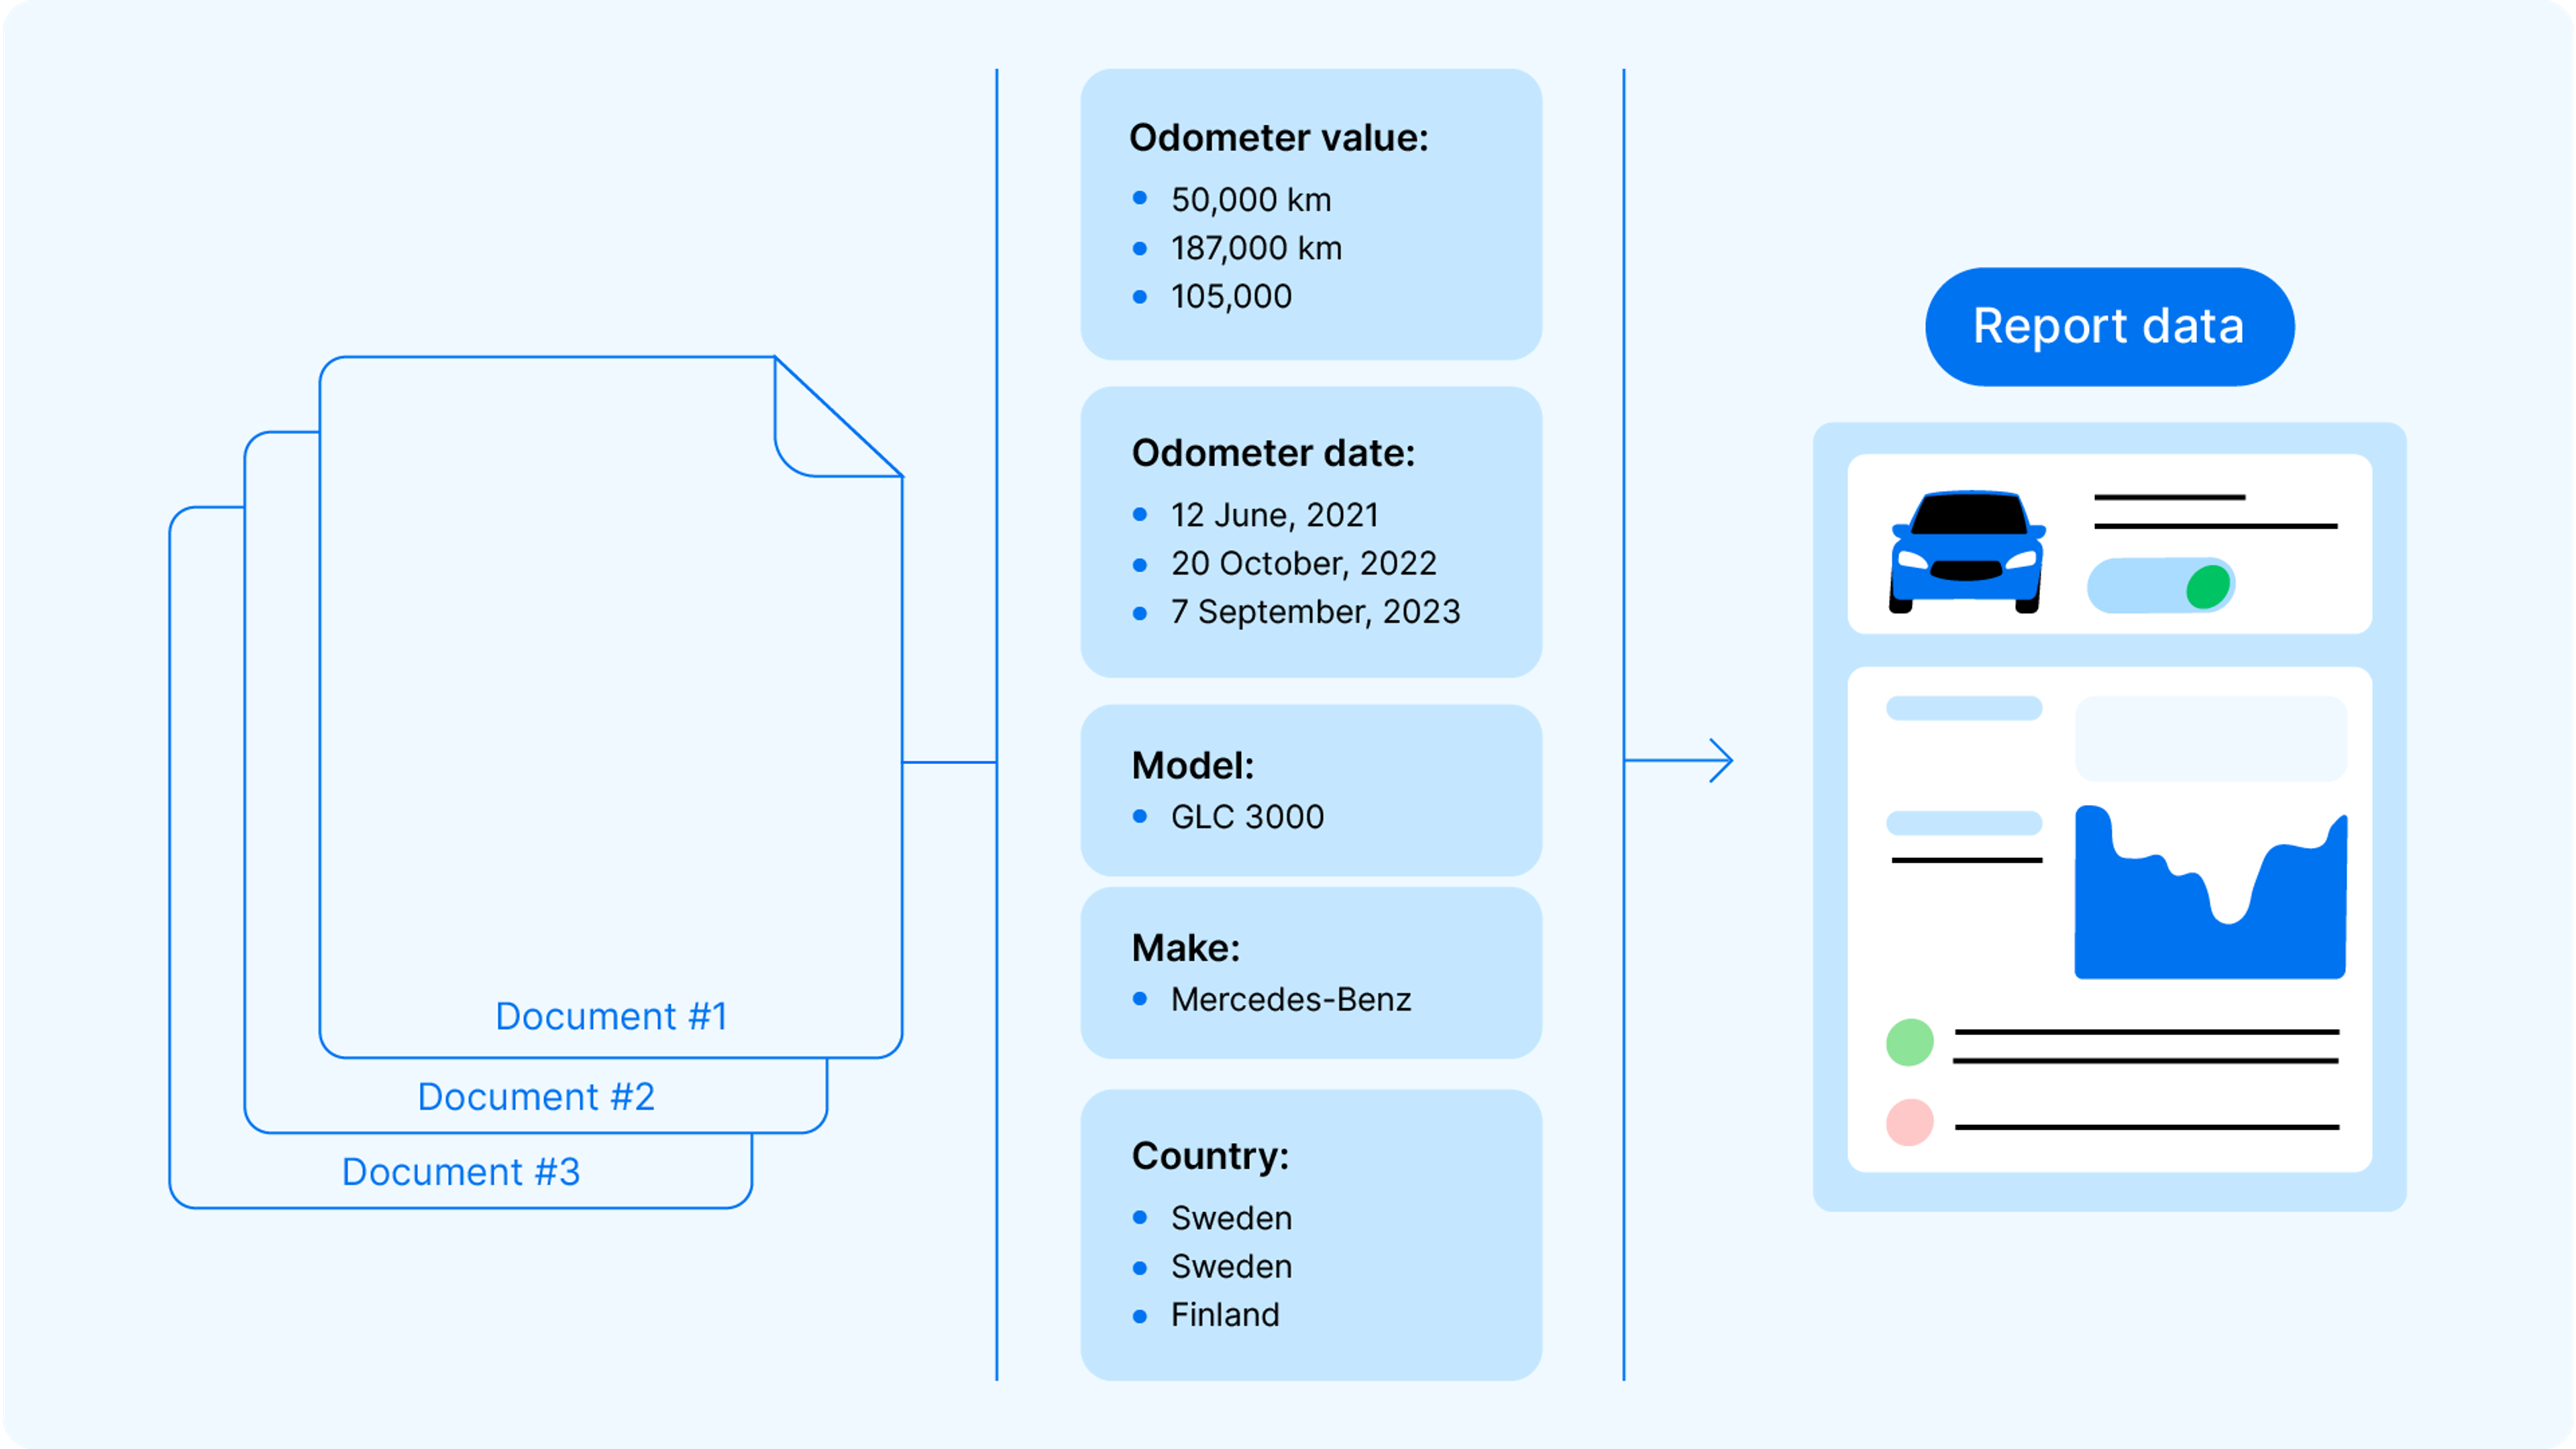
This information tells quite a story – we just have to put it together.
To do that, we group information types into our report sections. For example, we have 3 odometer readings and the dates when they were taken. These will appear in the Odometer section of the report. Meanwhile, the technical inspection information will be in the Legal status and Timeline sections, etc.
4. Using statistical models to generate insights and perform fixes
So we now have the data and it has been processed for use in a carVertical report. But there’s still more work to be done “under the hood” – mainly using statistical models and other technological solutions to fix issues and enrich the report.
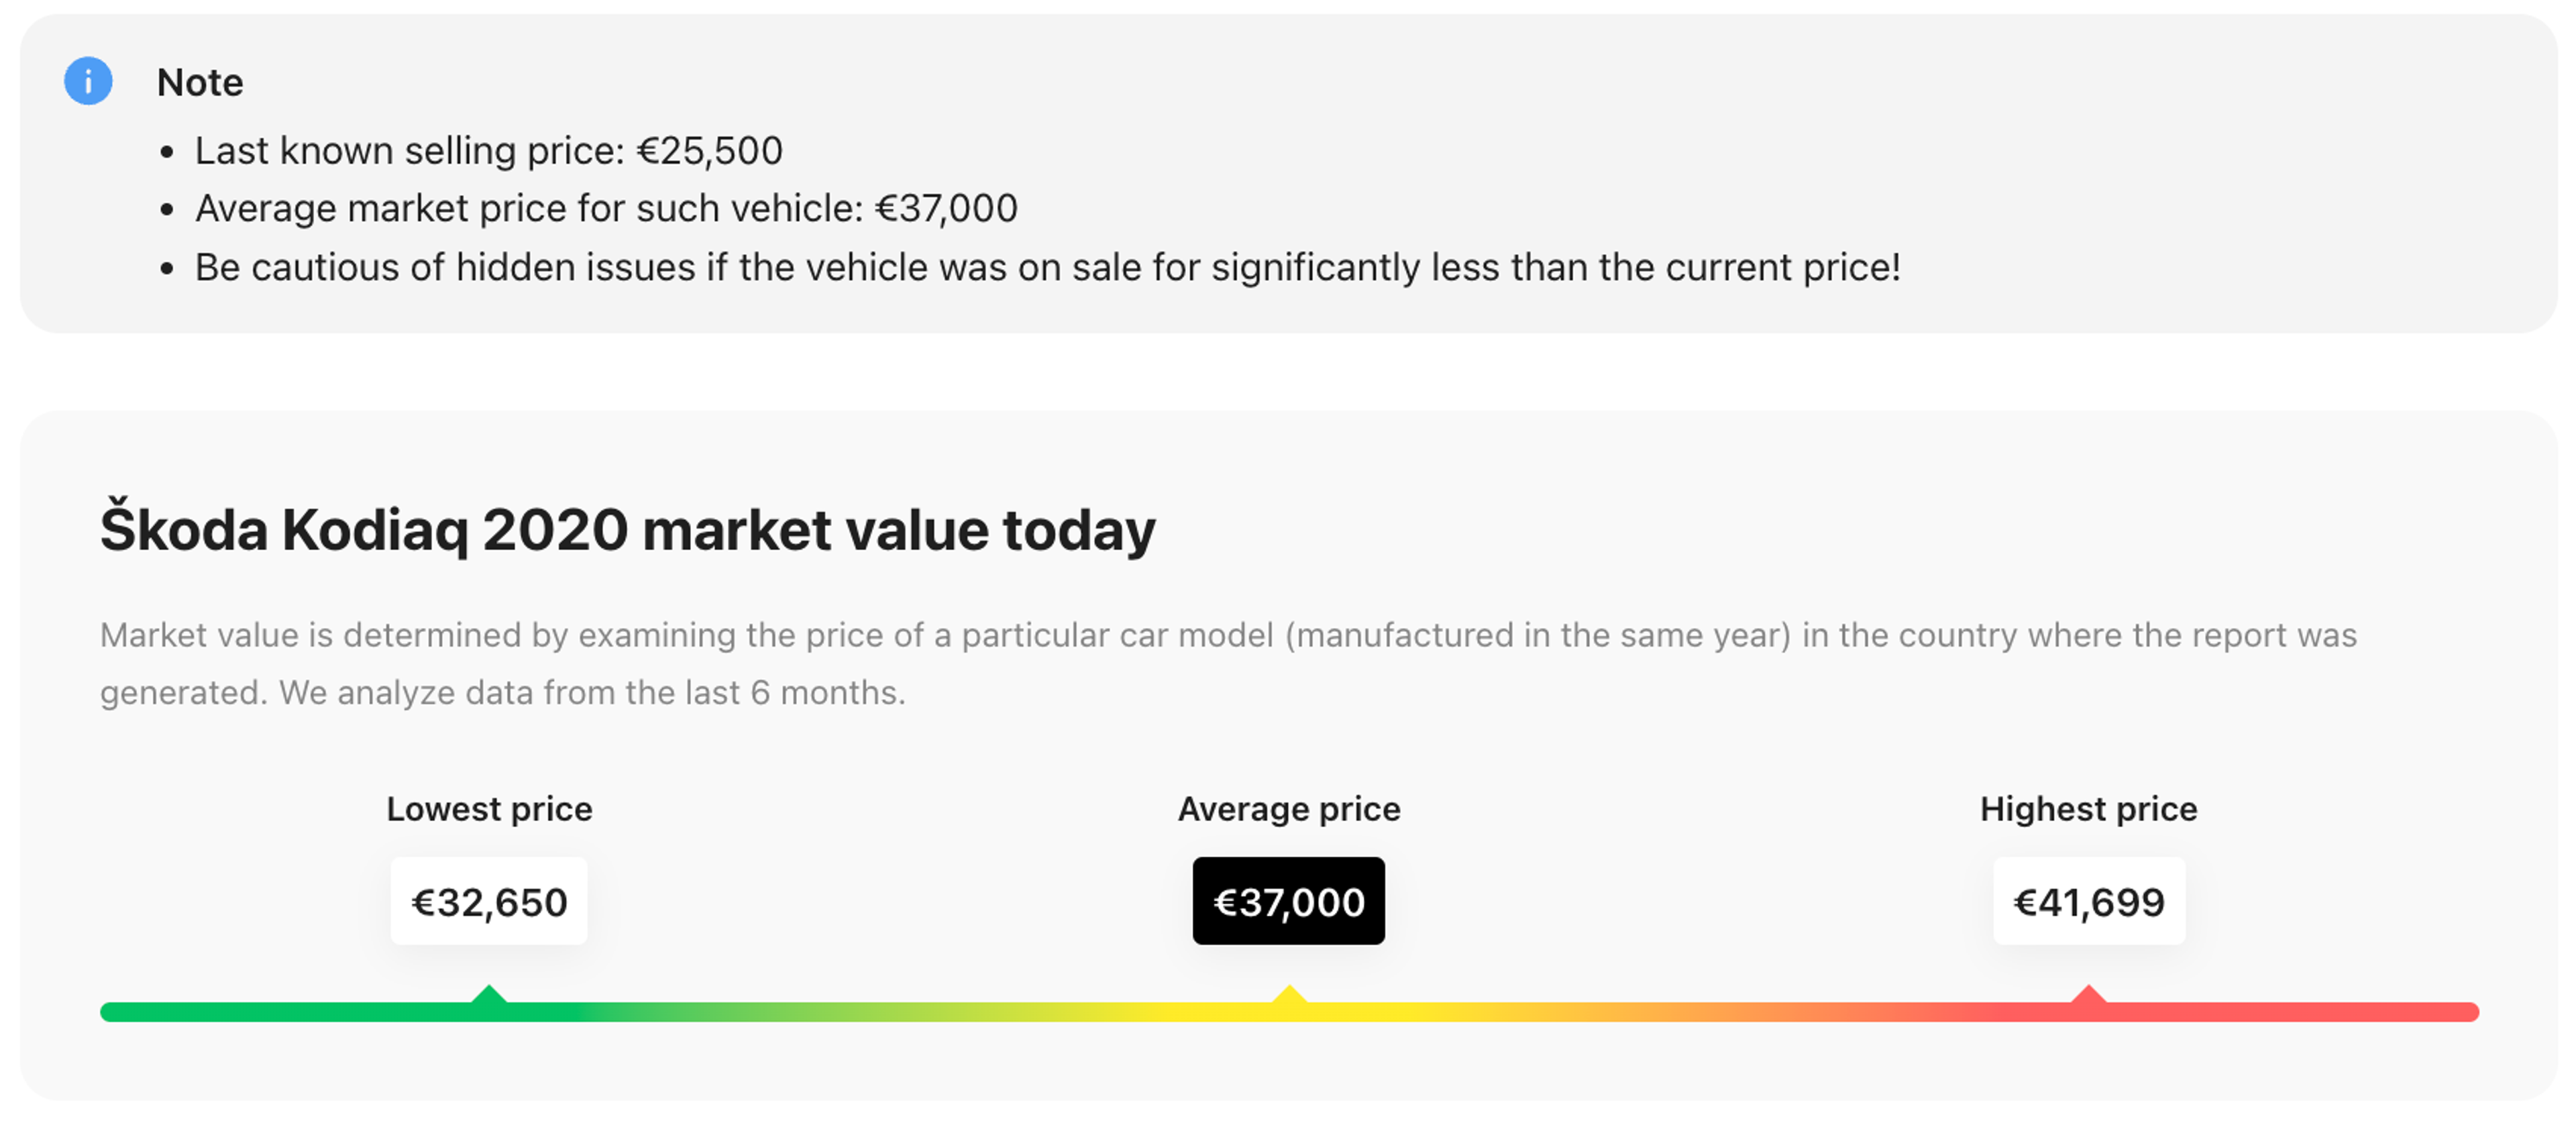
There are too many uses for these technologies to name, but as an example, we use statistical models to provide additional insights to users (e.g., we can compare the mileage of our example Mercedes with other cars of the same model, age, etc.).
This process works both ways: we use statistical models to enrich the current report, and we use data from the current report to enrich our statistical models.
5. Generating the report
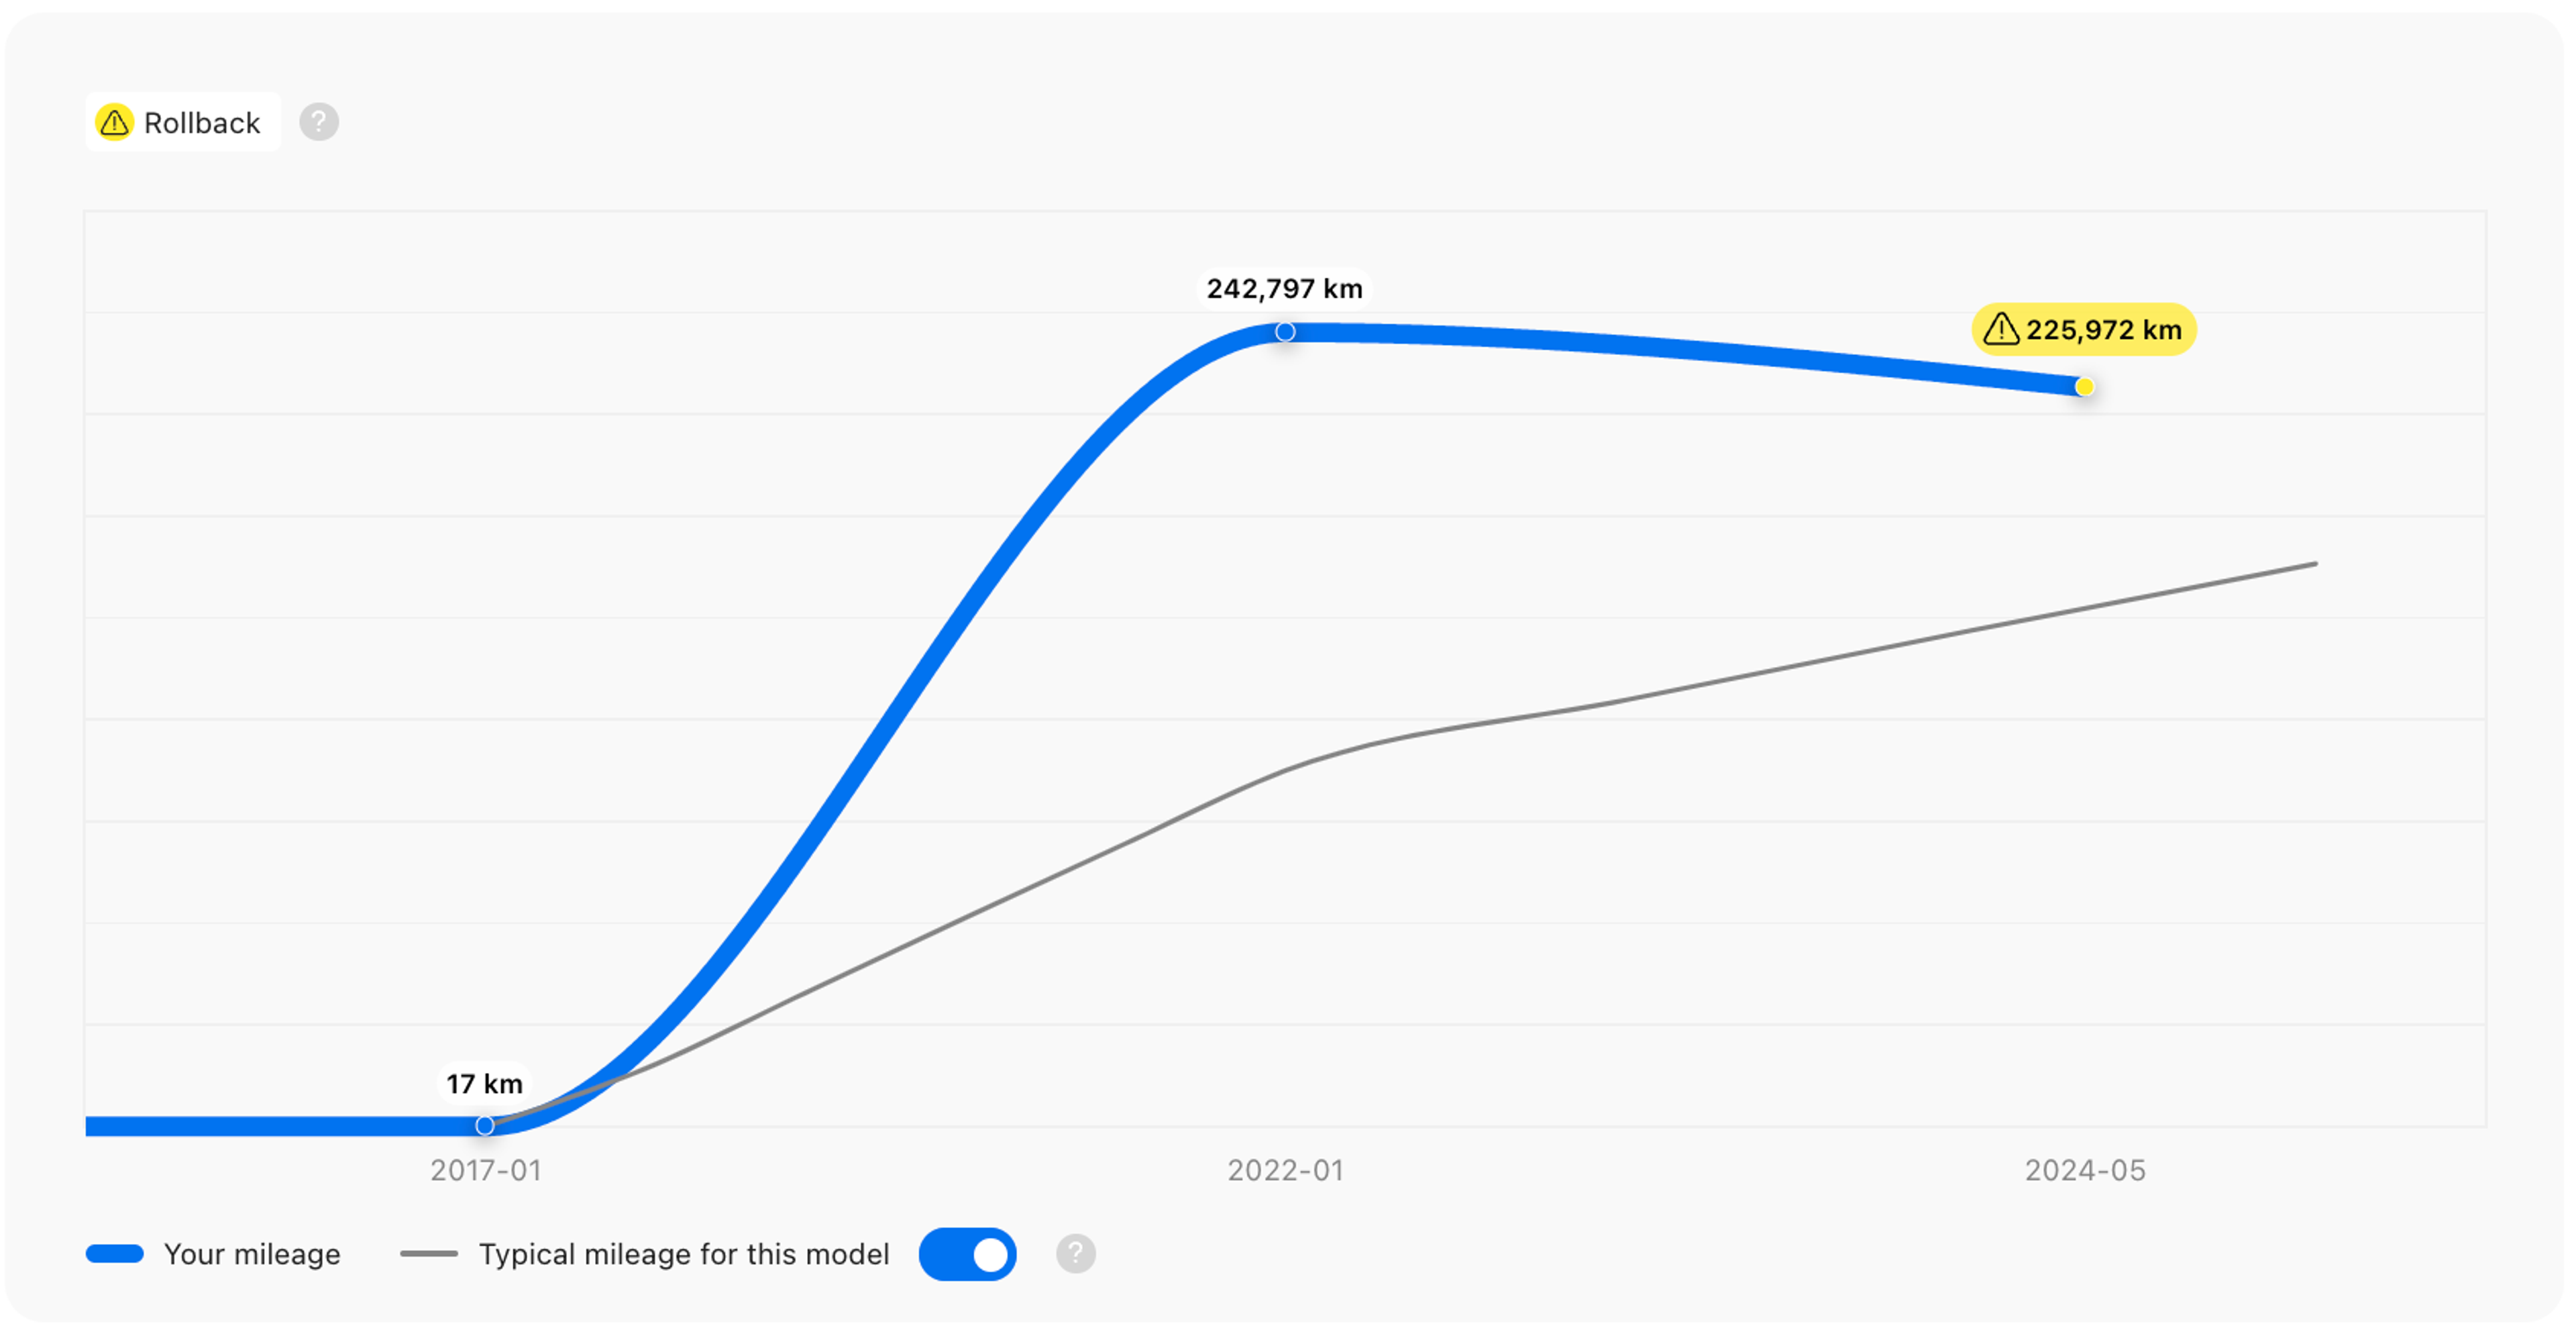
At this point, all the information we’ve gathered, cleaned, sorted, and enriched is used to generate a carVertical report. Let’s return to our Mercedes for a final example. Here’s what its Odometer section might look like:
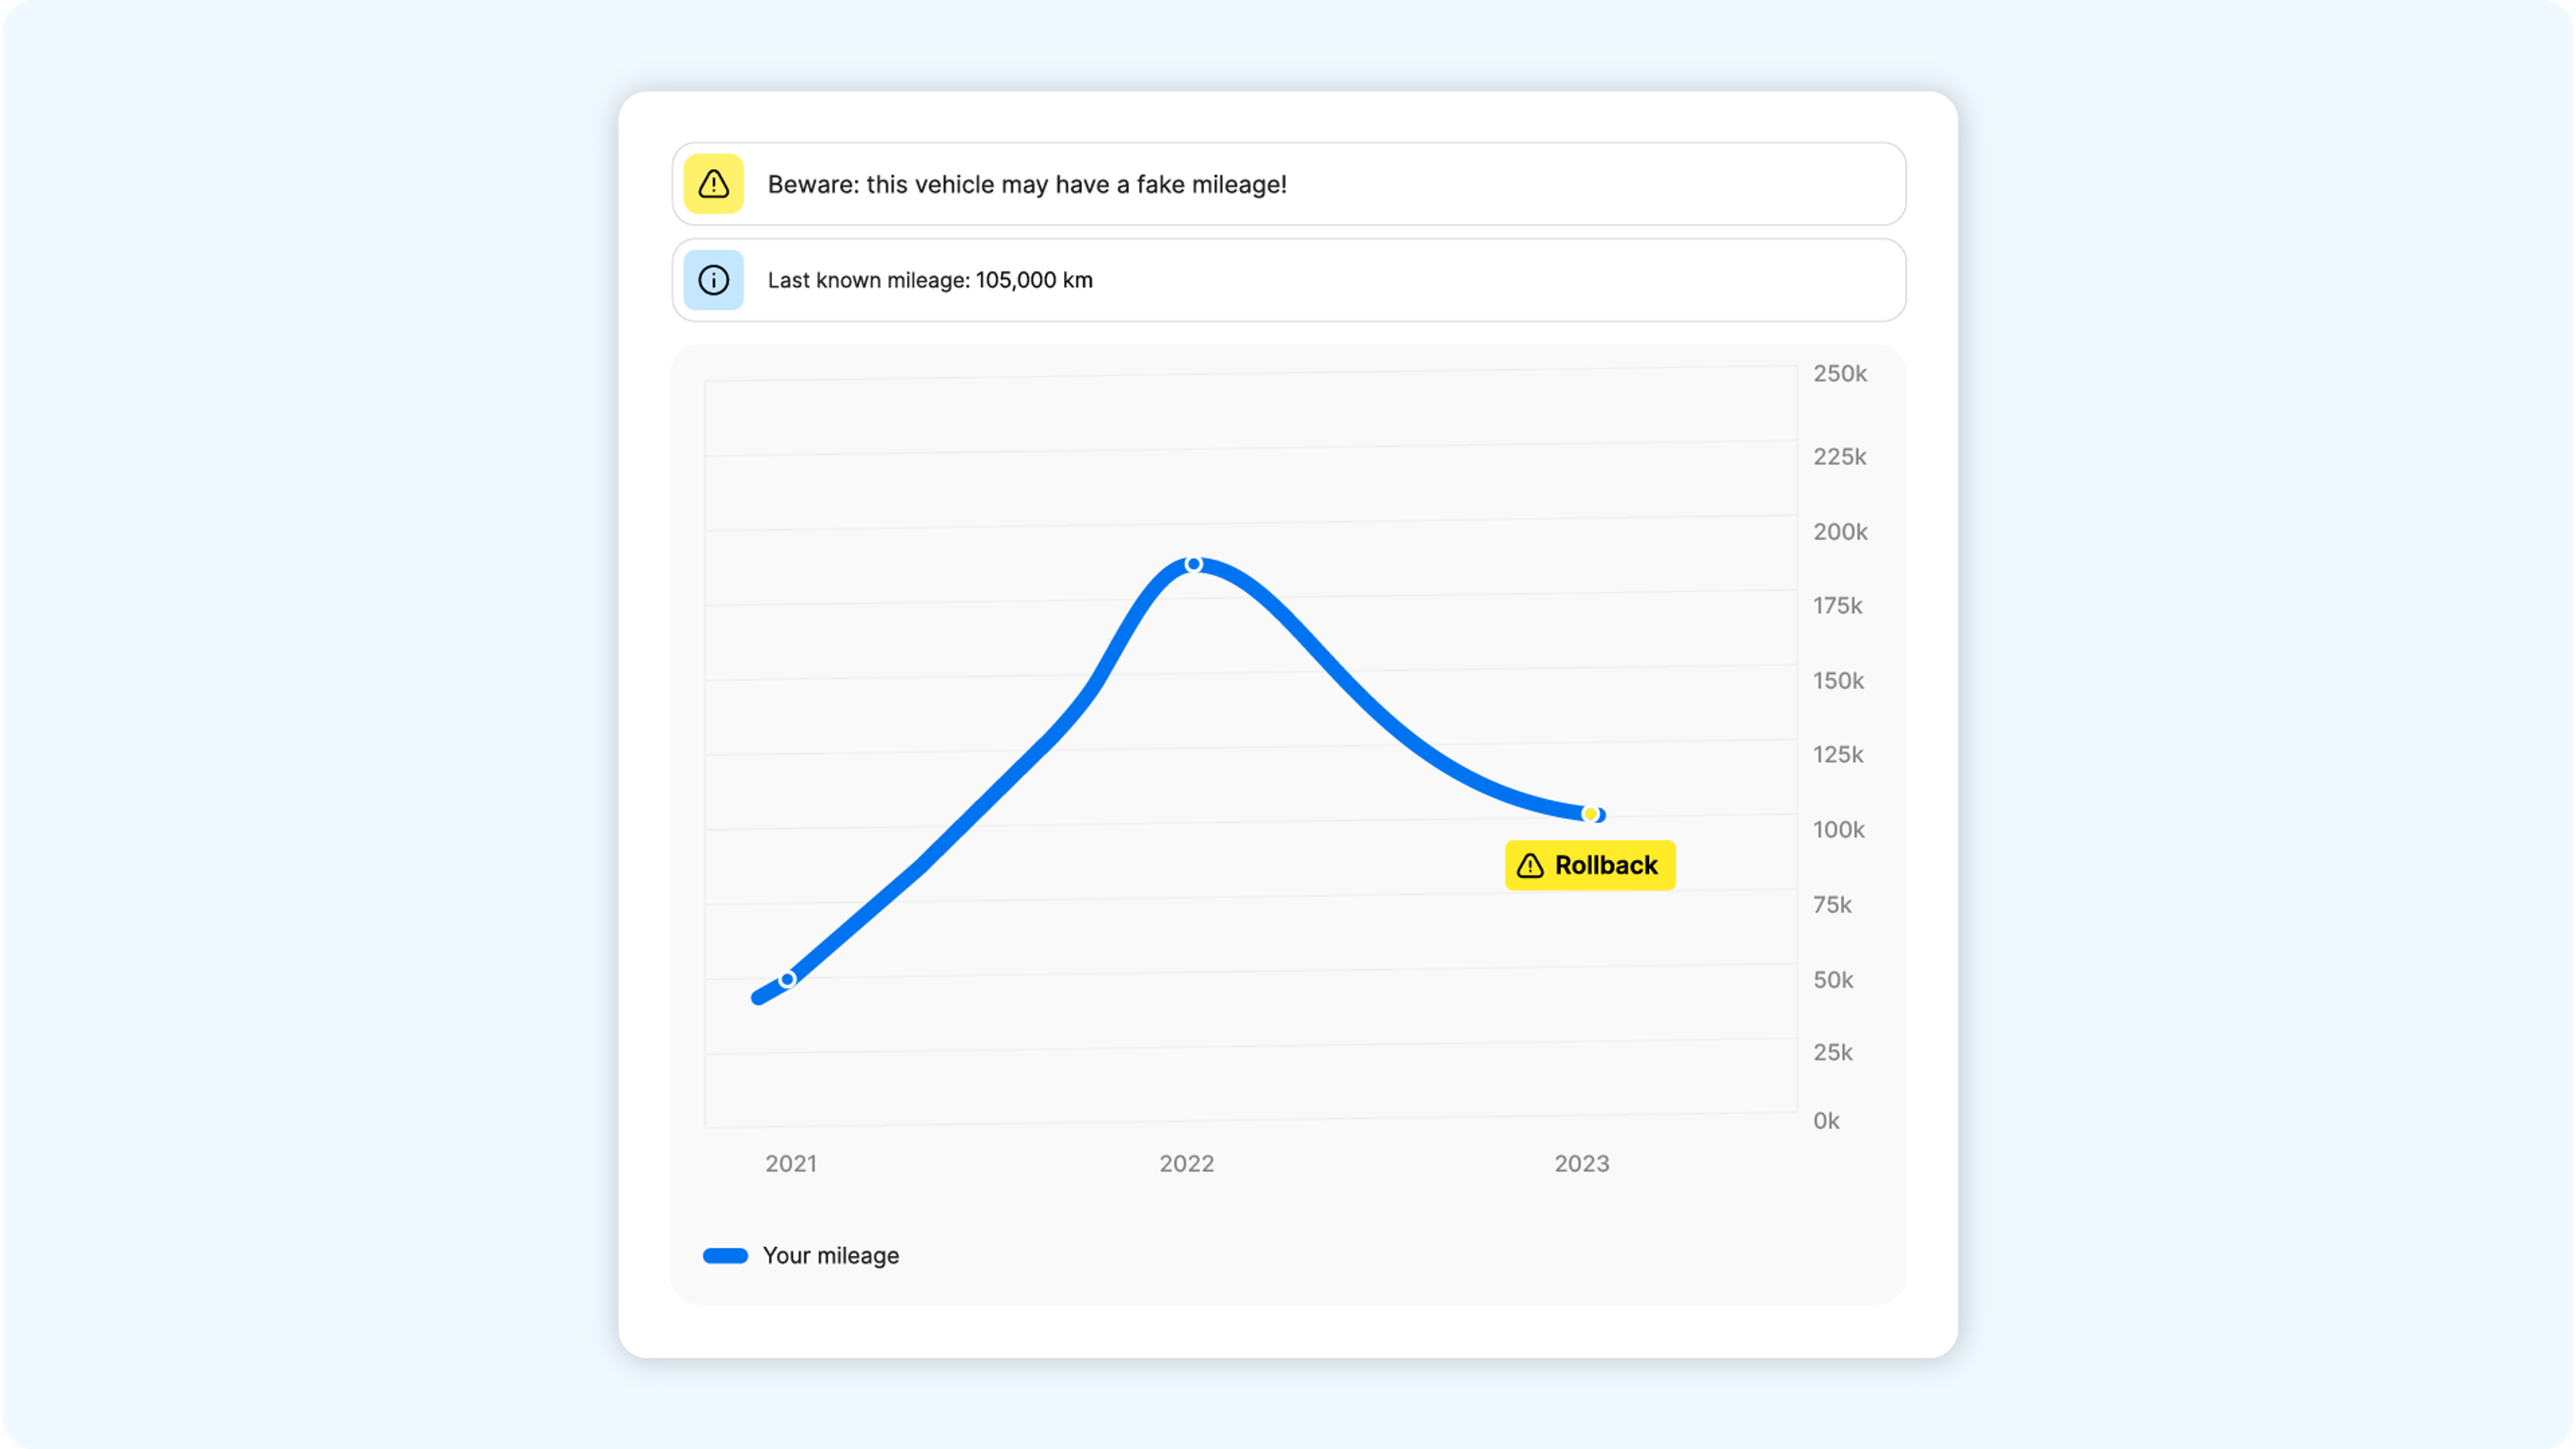
While this black Mercedes may seem appealing, the above graph should make any potential buyer think twice!
From the report, users would also learn about the car’s journey – arriving in Sweden, being sold to another owner in Sweden, and finally ending up in Finland. Using statistical models we can also provide the price range for this model of car, as well as an average mileage graph (although the latter would not change much, considering the mileage rollback!), and more.
Check your VIN
Avoid costly problems by checking a vehicle's history. Get a report instantly!
Damages, mileage readings, and everything else: Which data comes from what sources?
Without discussing specific databases / sources of specific information in our reports, we can look at some general rules for where certain types of data may come from.
Before we do that, however, it’s important to understand a couple of things:
- The same type of information can come from different types of sources. E.g., mileage records (even the same record) can come from a maintenance visit, a police record, or elsewhere.
- There’s a lot of variety from country to country. The same types of institutions may have different record-keeping roles in systems depending on the country.
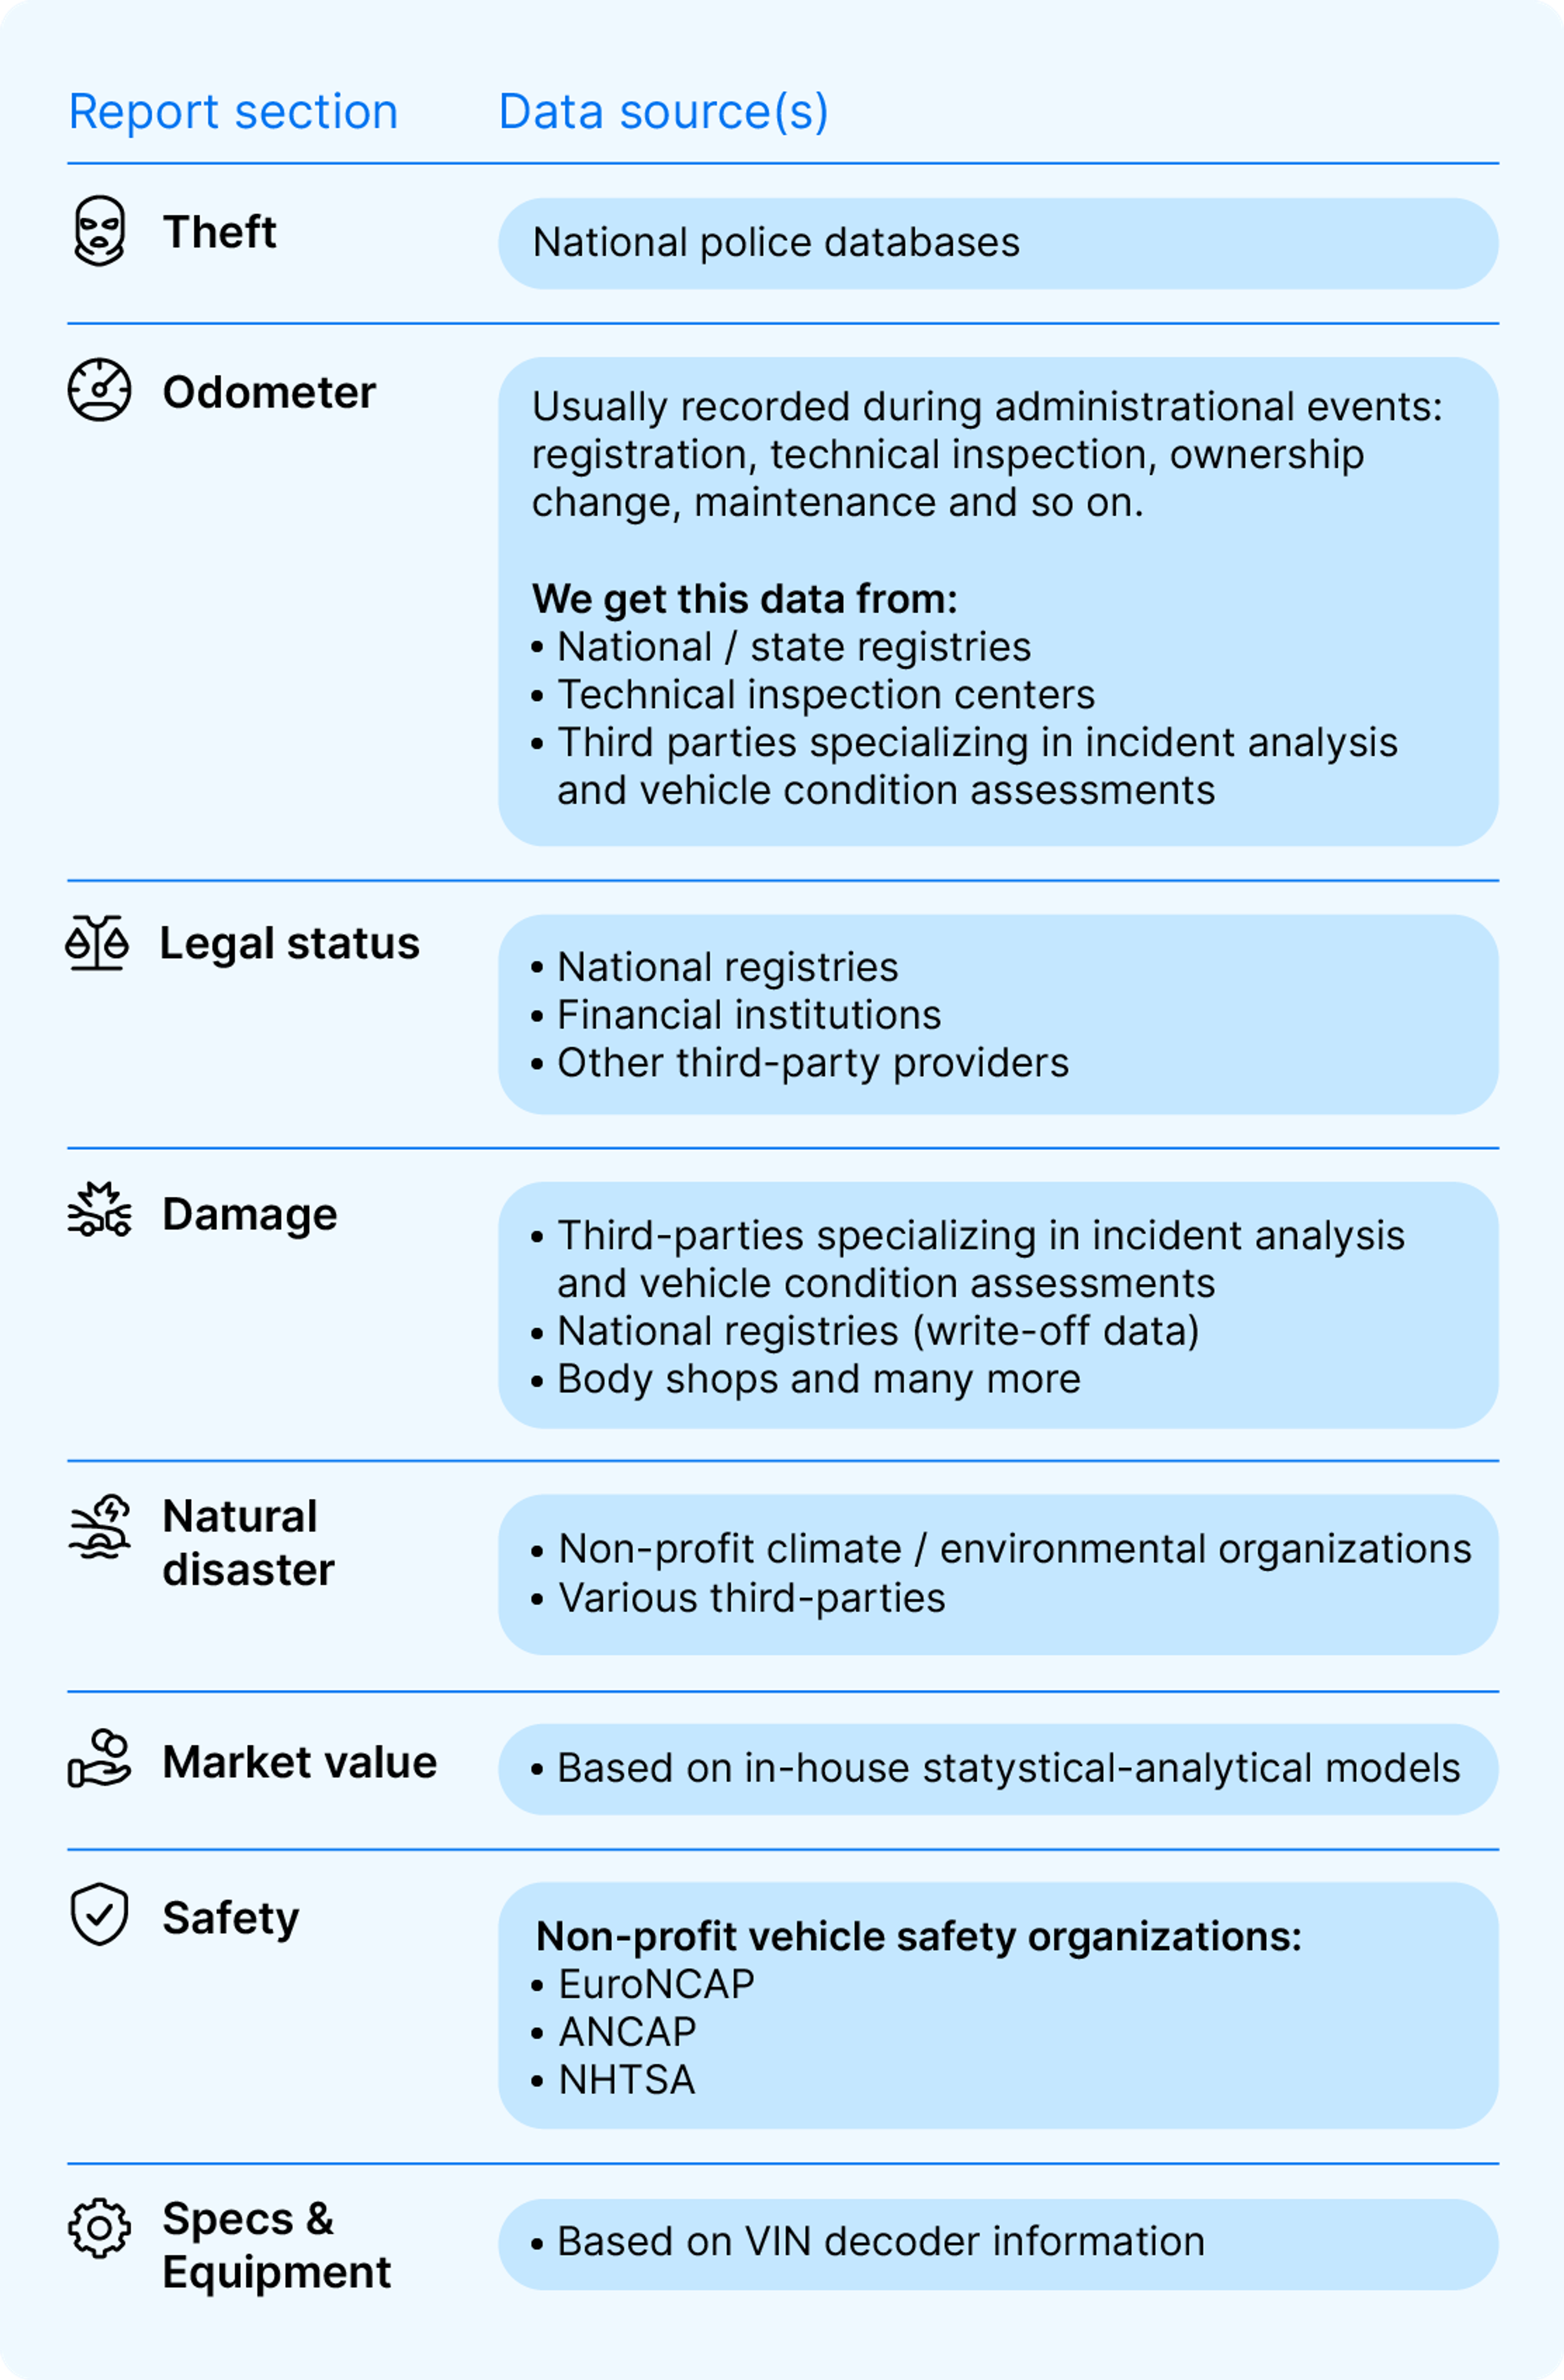
So where might you find those damage records, odometer readings, and other details?
carVertical is ISO/IEC 27001:2017 certified
As a company dealing with a lot of data, we take security very seriously. To prove our commitment, carVertical has earned ISO/IEC 27001:2017 certification – the global standard for information security.
What does this mean?
To receive ISO/IEC 27001:2017 certification, a company has to implement tools and procedures, protecting all verbal, written, and electronic information received, sent, created, managed, and used from all possible threats: external, internal, intentional, or accidental.
This certification means we’ve put in place strict measures to protect all verbal, written, and electronic information from any threats—be they external, internal, accidental, or intentional.
What does this mean for you? Your personal data, report data, and financial details are all protected by top-tier security systems. Want more details? Check out our Information Security Policy and Information Security Management System (ISMS).
Meet the carVertical data team!

The carVertical report is simple and easy to read, but there’s a lot that goes into that simplicity. Our Data Department is a good reflection of this: carVertical currently has almost 200 employees, and as much as 15% of them work on data.
That’s a significant number of people who are good at math!
The Department has 4 specialized teams:
- Data Acquisition focuses on gathering raw data
- Data Engineering is responsible for building and maintaining our data infrastructure and pipelines
- Machine Learning Engineering develops and deploys machine learning models
- Data Analytics analyzes data to extract insights and inform business decisions
Each of these teams plays a crucial role in making the carVertical report – we literally would not exist without them!
Frequently asked questions
Article by
Tadas Švenčionis
Tadas is the Editor in Chief of the carVertical Blog. A fan of all things automotive and tech, he makes a point of making complex topics simple and engaging – after all, what good is a story no one understands? Tadas spends his free days reading, gaming, and bringing music no one’s asked for to Vilnius, Lithuania.