
Engine power is among the key considerations when buying a car. However, the excitement of driving a powerful vehicle can lead to overlooking the risks that come with it.
Are drivers of powerful cars more likely to get into accidents due to their vehicles’ capabilities?
We analyzed thousands of carVertical history reports globally to determine whether there is a connection between a vehicle’s average engine power and the share of accidents it had been involved in.

Afraid of buying a wreck?
Check any VIN to learn a vehicle's history!
Research findings
Our research shows that there’s a direct correlation between the average horsepower under the hood and spotted damage history:
- Without exceptions, more powerful models within all makes have a higher rate of recorded accidents than those with lower engine power.
- The highest share of cars with a damage history is seen among BMW (68.6%), Tesla (62%), and Audi (55.6%) models with400+ kW engine power.
- The lowest share of cars with a damage history is found among Lancia (13%), Smart (19.4%), and Alfa Romeo (20.3%) vehicles (with an average engine power of up to 100 kW).
- Out of all cars checked on carVertical, Bentley (415 kW), Maserati (268 kW), and Cadillac (264 kW) models have the highest average engine power and damage rates of 53.1%, 45.8%, and 39.4%, respectively.
- On the contrary, vehicles from two of the least powerful makes, Smart (59 kW) and Lancia (77 kW), have the lowest share of damages (19.4% and 13.2%).
- BMW (168 kW), Tesla (263 kW), and Hyundai (105 kW) lead with the highest overall percentage of cars with damage records among all checked vehicles, reaching 62.2%, 56.07%, and 55.33%, respectively.
Direct correlation between engine power and damage history with no exceptions
The research has revealed that within each brand, higher-powered models had a higher share of cars that had been damaged compared to their less-powerful counterparts. The difference between the least and most damaged models across all makes varies from 1.02 to 1.42 times.
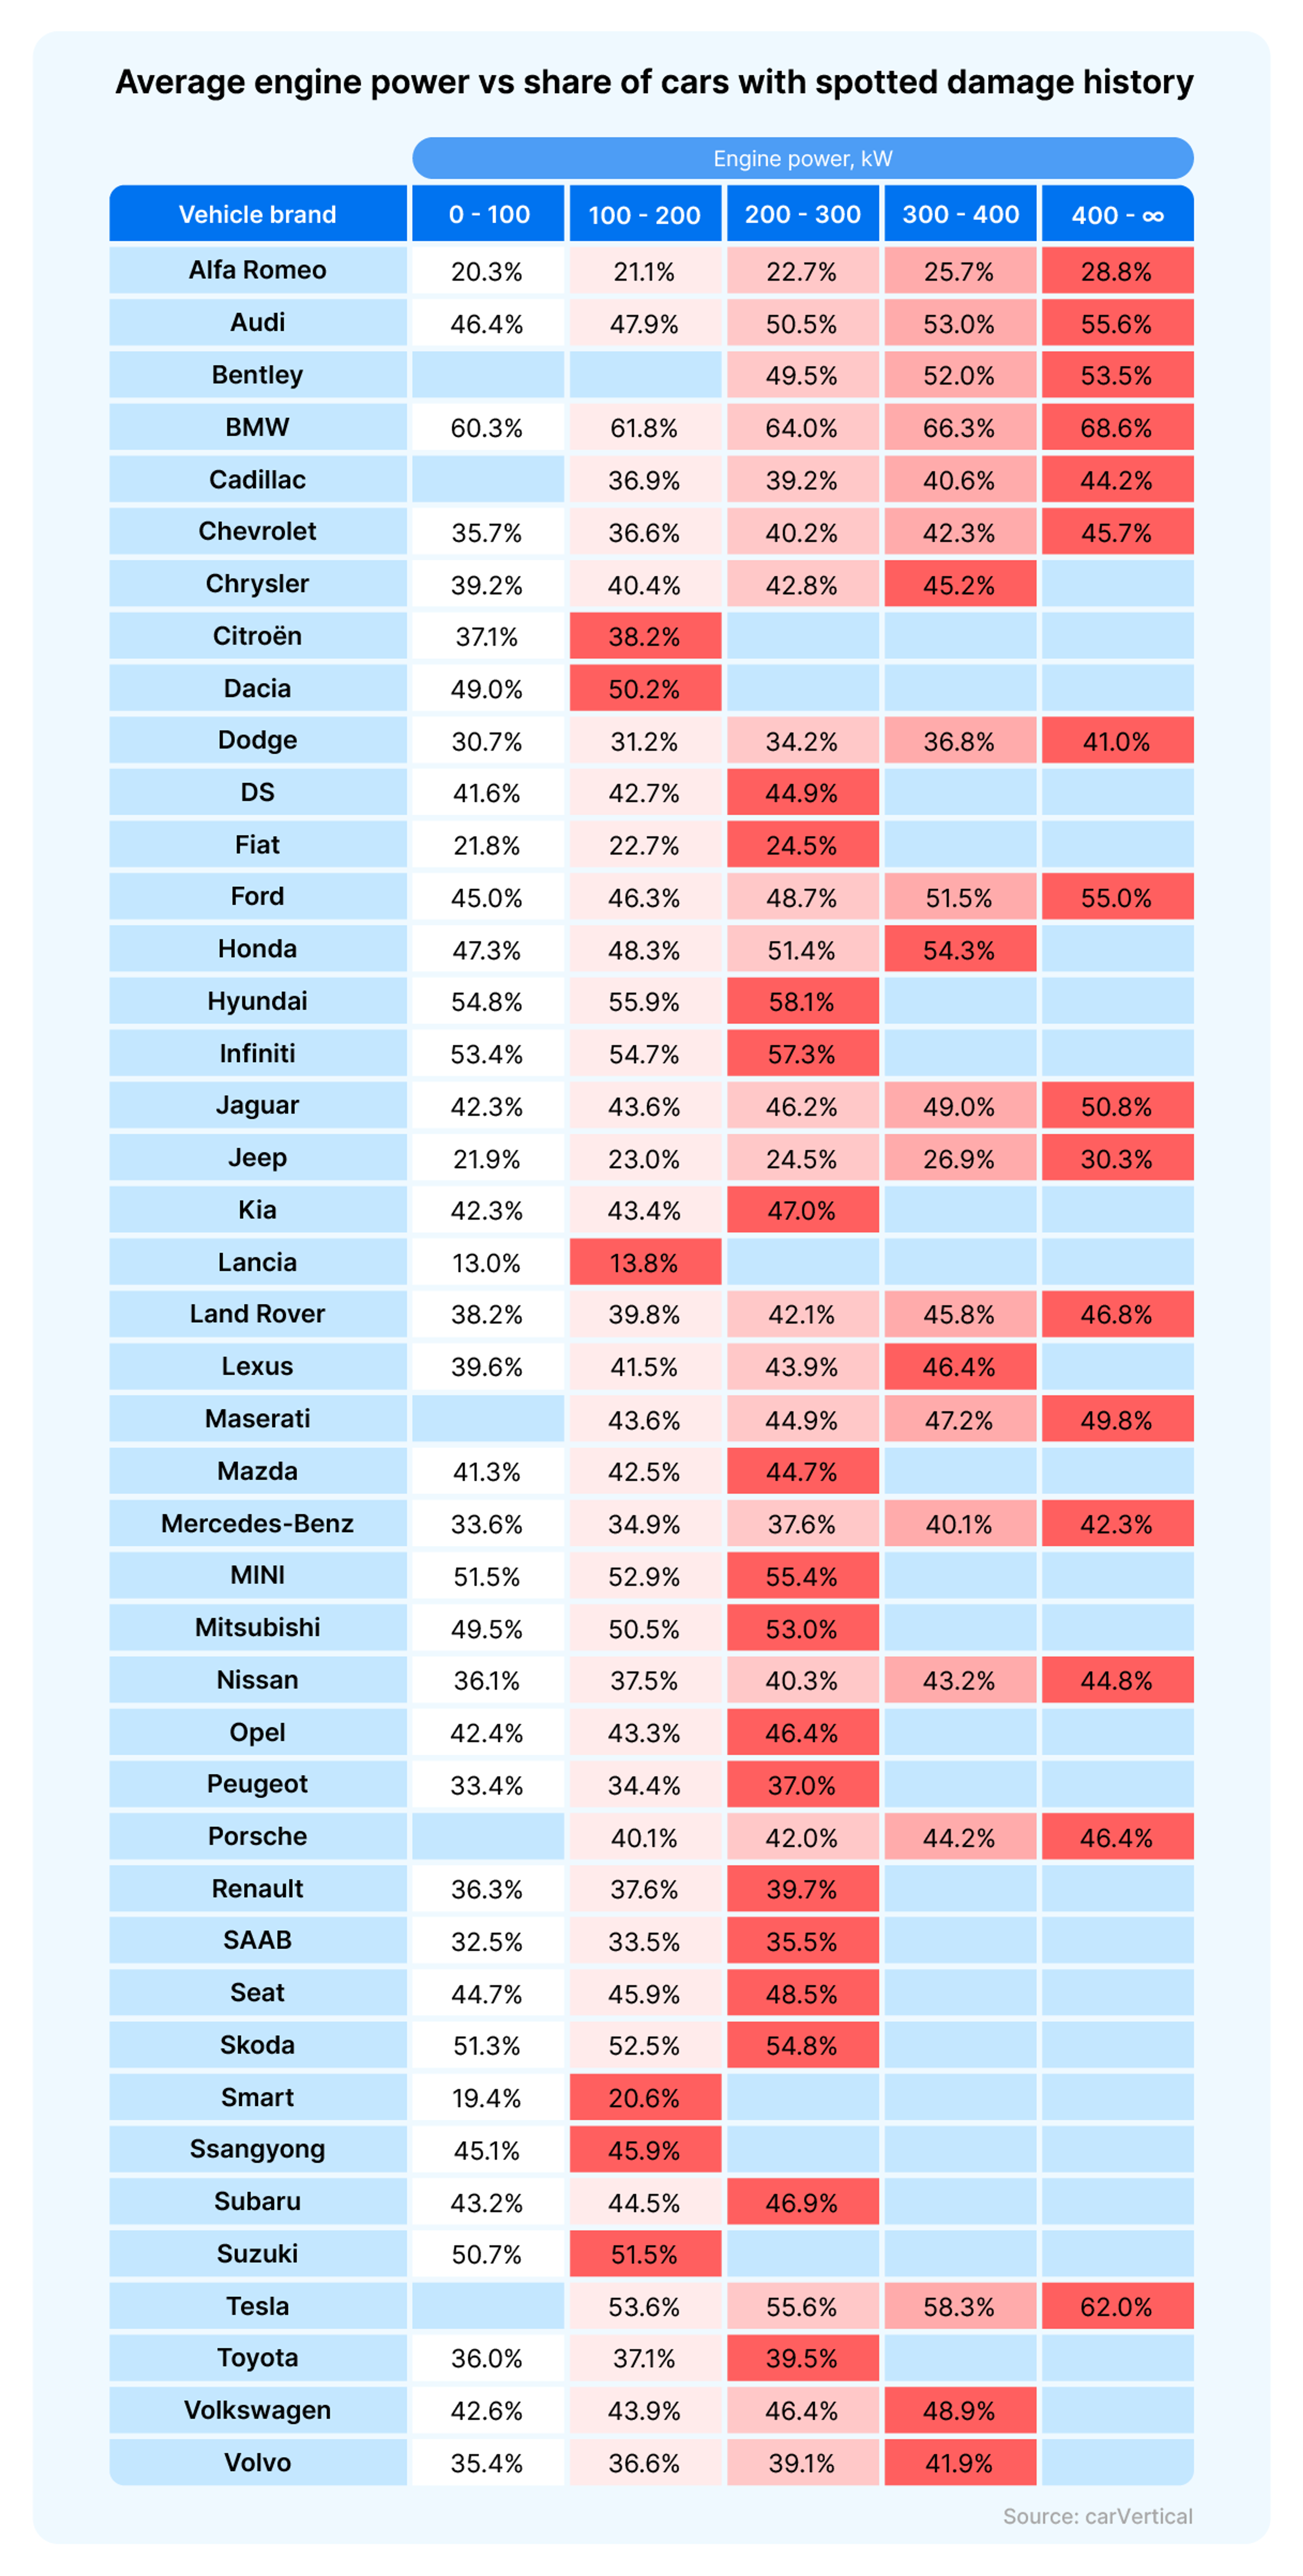
For instance, over half (53.6%) of Tesla vehicles with 100-200 kW engines have a recorded accident history, and the frequency of damage records increases with higher engine power. The damage rate among Tesla models with 200-300 kW under the hood is 55.6%, among Teslas with 300-400 kW engines – 58.3%, whereas a whopping 62% of 400+ kW Tesla cars have damage records.
Out of all cars checked on carVertical, BMW vehicles with engines starting from 400 kW “lead” with a staggering 68.6% of damaged models. However, BMW models with engines of up to 100 kW are not that far behind – 60.3% of such BMWs checked on carVertical have been involved in accidents.
The tendency remains even among makers of less-powerful cars. For example, while 13% of Lancia models with engines of up to 100 kW are damaged, this number increases to 13.8% for its models with 100-200 kW engines.
BMW leads with the highest share of damaged cars, followed by Tesla and Bentley
The graph below shows that makers of some of the most powerful vehicles also tend to have the highest damage rates, which proves the direct connection between average engine power and accident history.
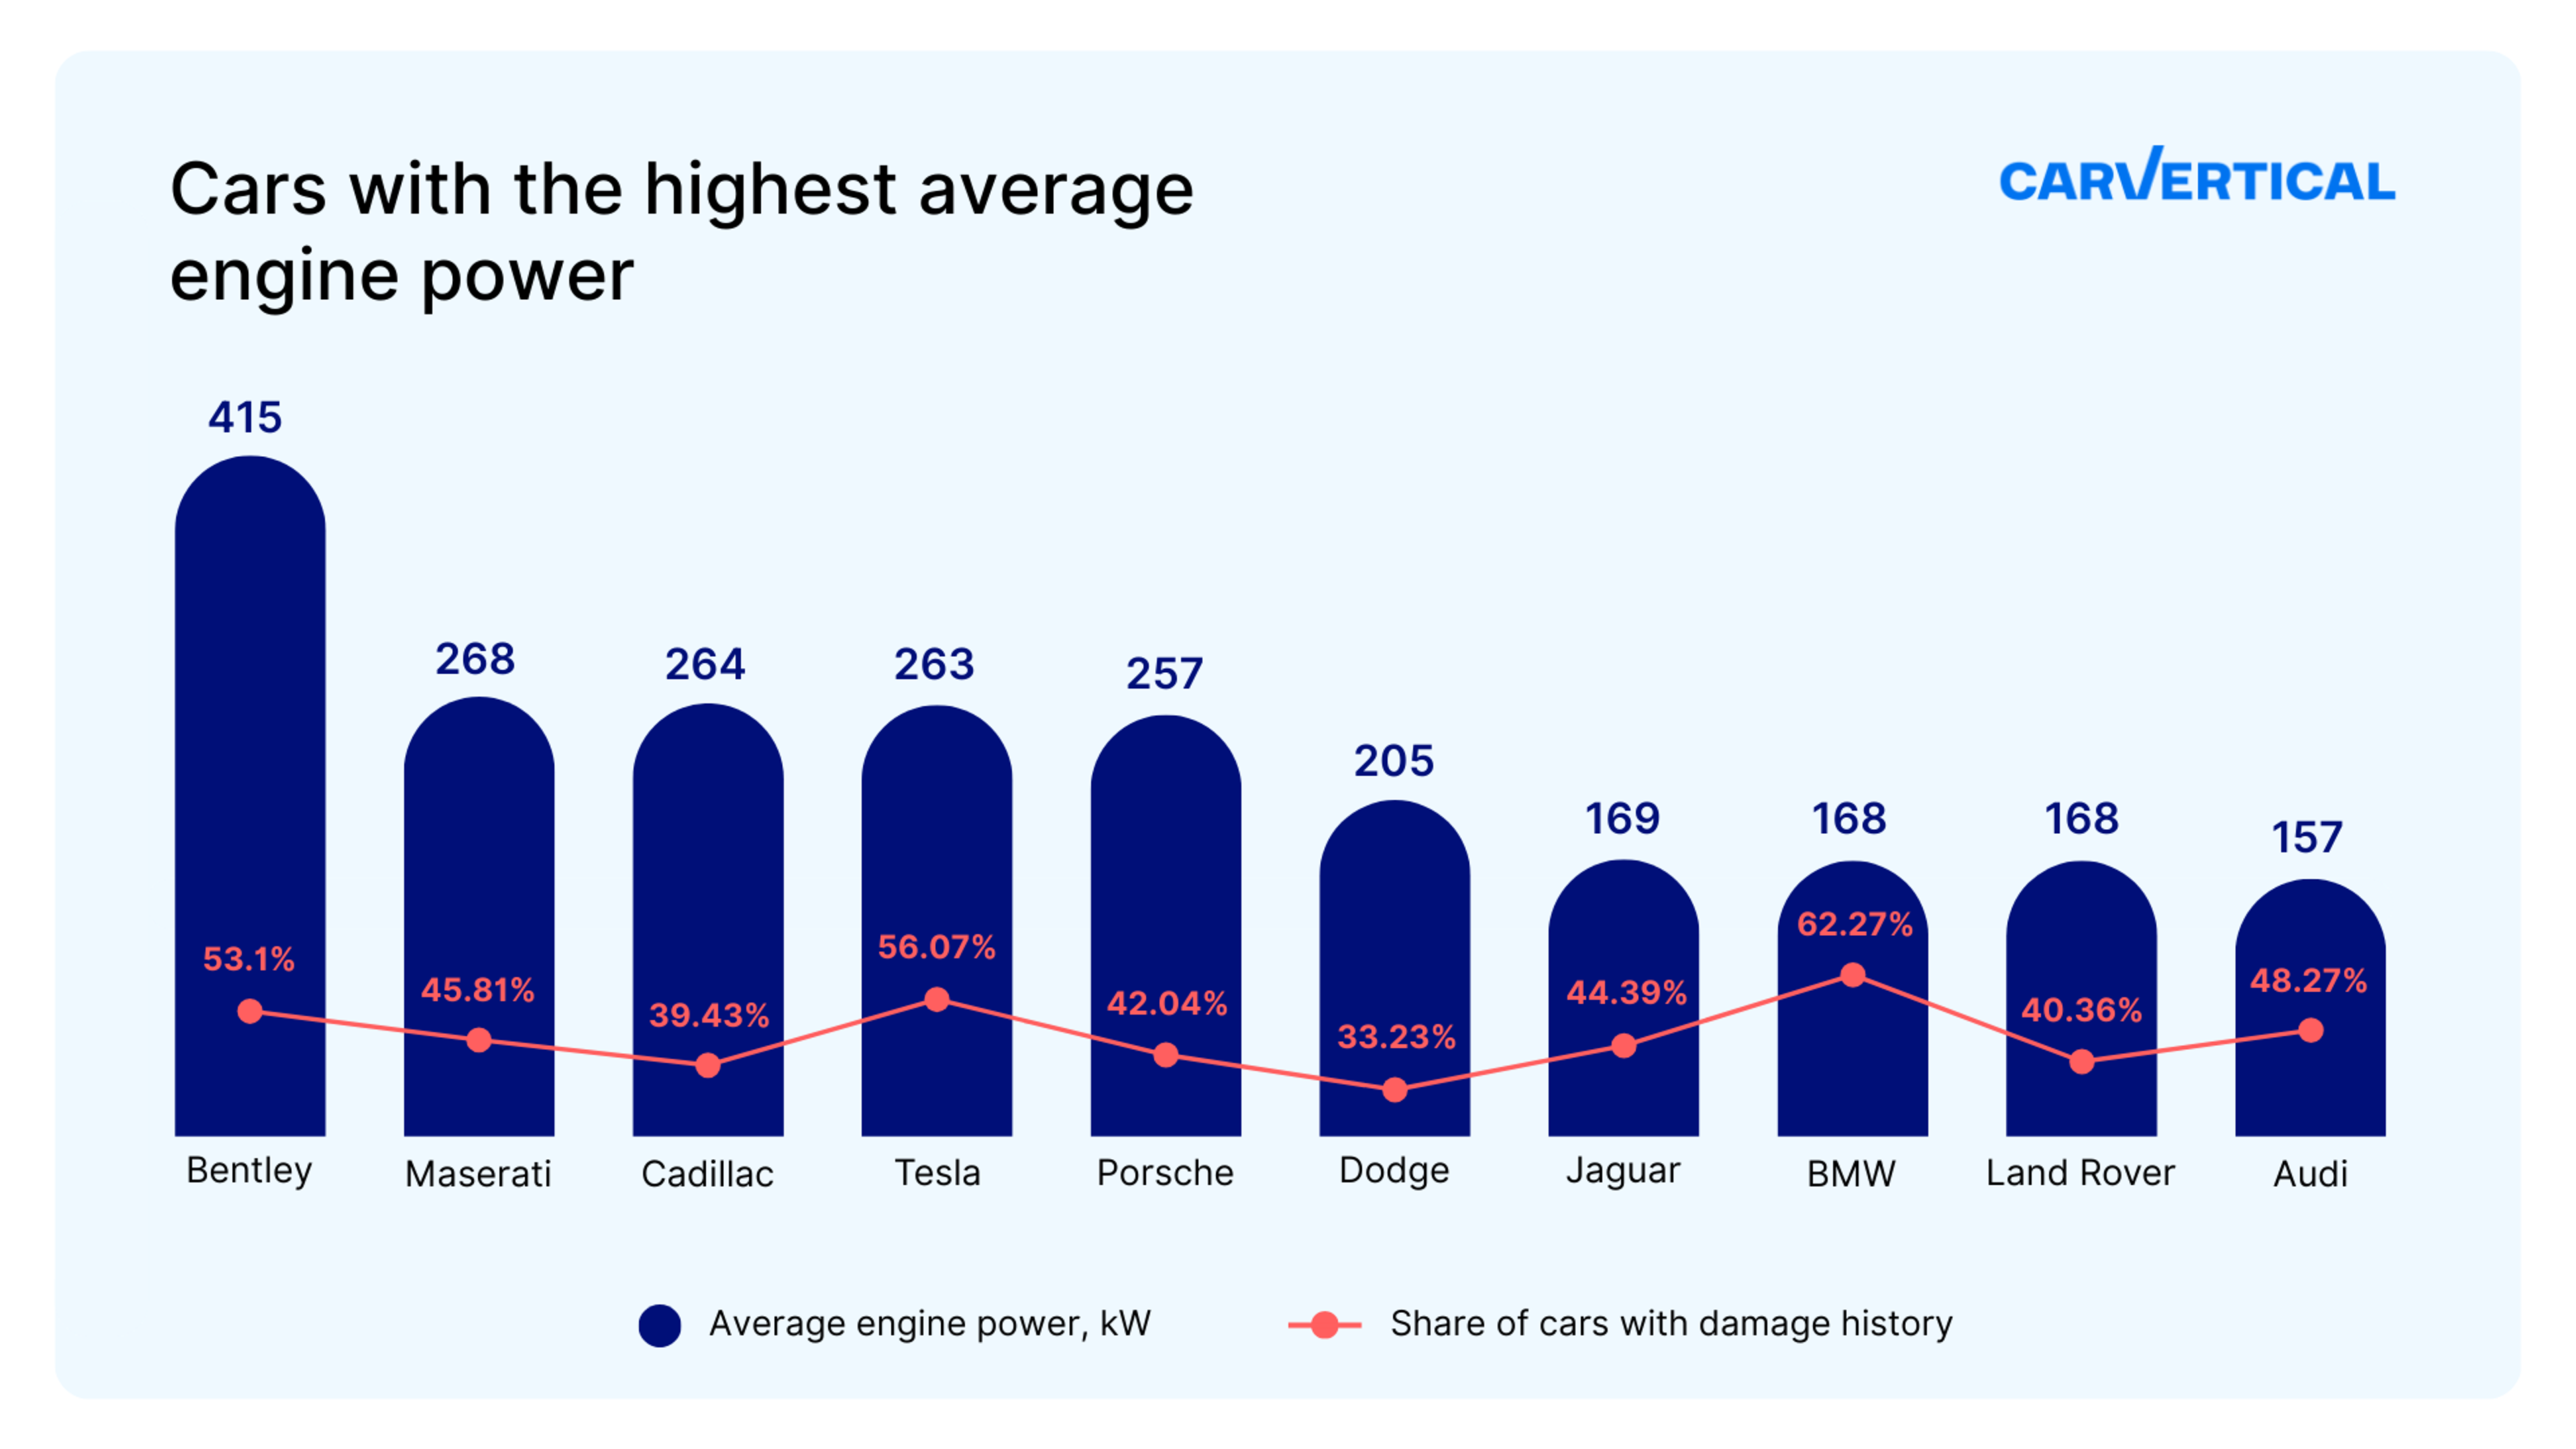
For instance, BMW, which has an average engine power of 168 kW, ranks at the top of the most damaged cars list. On average, a mind-boggling 62.27% of this German manufacturer’s vehicles checked on carVertical have been in an accident. In other words, there are over 6 in 10 chances of purchasing a car with potentially concealed damage when buying a used BMW.
Of all checked Teslas (with an average engine power of 263 kW), 56.07% have damage records, and so do 53.1% of Bentley (avg. 415 kW) vehicles. Audi (avg. 157 kW) follows the pack with an average of 48.27% damaged cars, while Maserati (avg. 268 kW) models have a damage rate of 45.81%.
Smart with the lowest average engine power has some of the least damages
Although the research showed that used vehicle buyers check higher-powered cars more often, small cars with lower engine power are also inspected on carVertical.
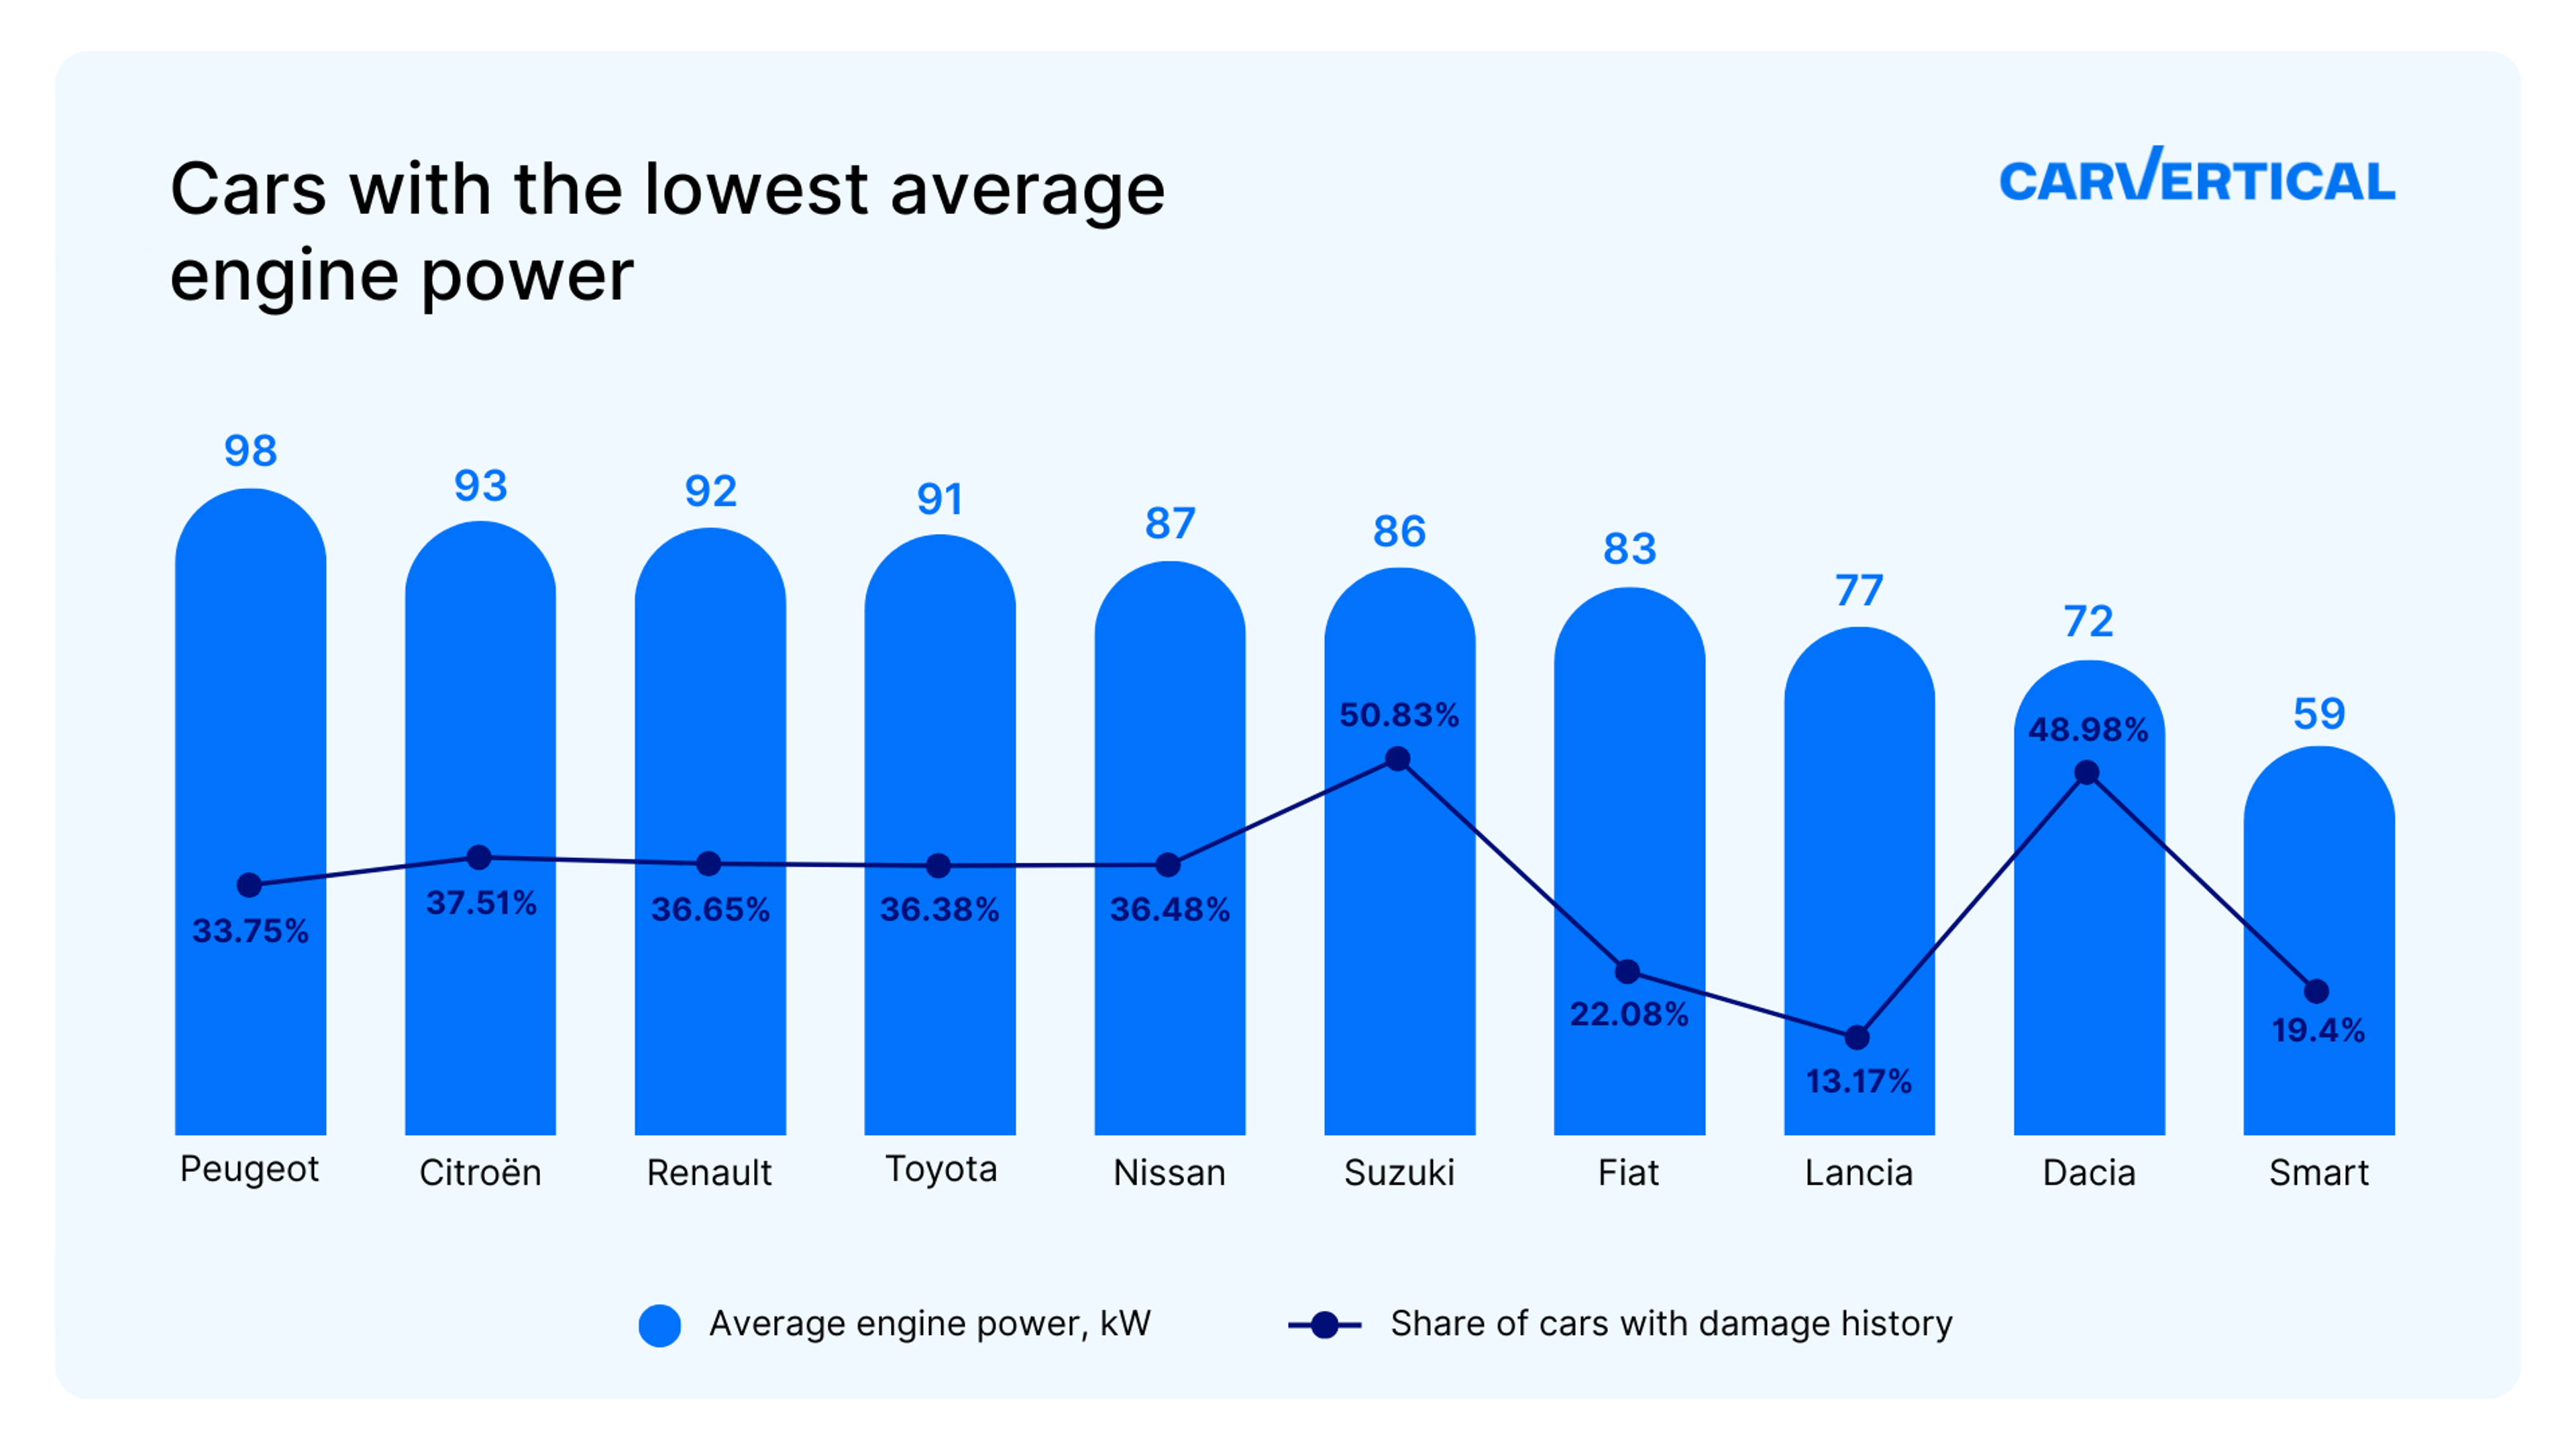
Some cars with the lowest average engine power have significantly fewer damage records than higher-powered vehicles. For instance, one of the least powerful vehicle brands checked, Lancia, has less than 4 times the share of damaged cars (13.17%) compared to Bentley cars (53.1%).
Smart, which boasts the lowest average engine power among all checked brands, exhibits an average damage rate of 19.4%, followed by Fiat (22.08%) and Peugeot (33.75%).
Dacia (72 kW) and Suzuki (86 kW) cars are exceptions to the rule – they rank among the vehicles with the lowest average engine power.
Methodology
To determine the correlation between average engine power and the share of cars with spotted damage history, we analyzed thousands of vehicles checked on carVertical worldwide. The data was collected from vehicle history reports, organized by car brand and average engine power values, and ranked accordingly.
Doing so allowed us to spot patterns and prevailing trends related to vehicle damage history among higher-powered and least-powerful vehicles from 43 automakers.
Concealed damage can turn car ownership into a nightmare
Concealed damage refers to any damage that exists on a car but is not disclosed or apparent upon inspection. Even if a car has been repaired, structural damage and mechanical issues can still linger, therefore, the occurrence of an accident should be disclosed when selling a used vehicle.
Otherwise, such damage can not only lead to unexpected and expensive repairs but also compromise the vehicle's safety. Not to mention decreased resale value and the stress that comes with buying a car in worse condition than you’d expected.
To prevent this from happening, it’s important to 1) get a vehicle history report and 2) have a car professionally inspected to determine whether damages (if any) may impact its long-term use.

Check your VIN
Avoid costly problems by checking a vehicle's history. Get a report instantly!
A vehicle history report can help you learn more about the car you plan to buy and identify its potential weak spots, as they can reveal damage and mileage records, financial and legal status, ownership and title changes, and more.
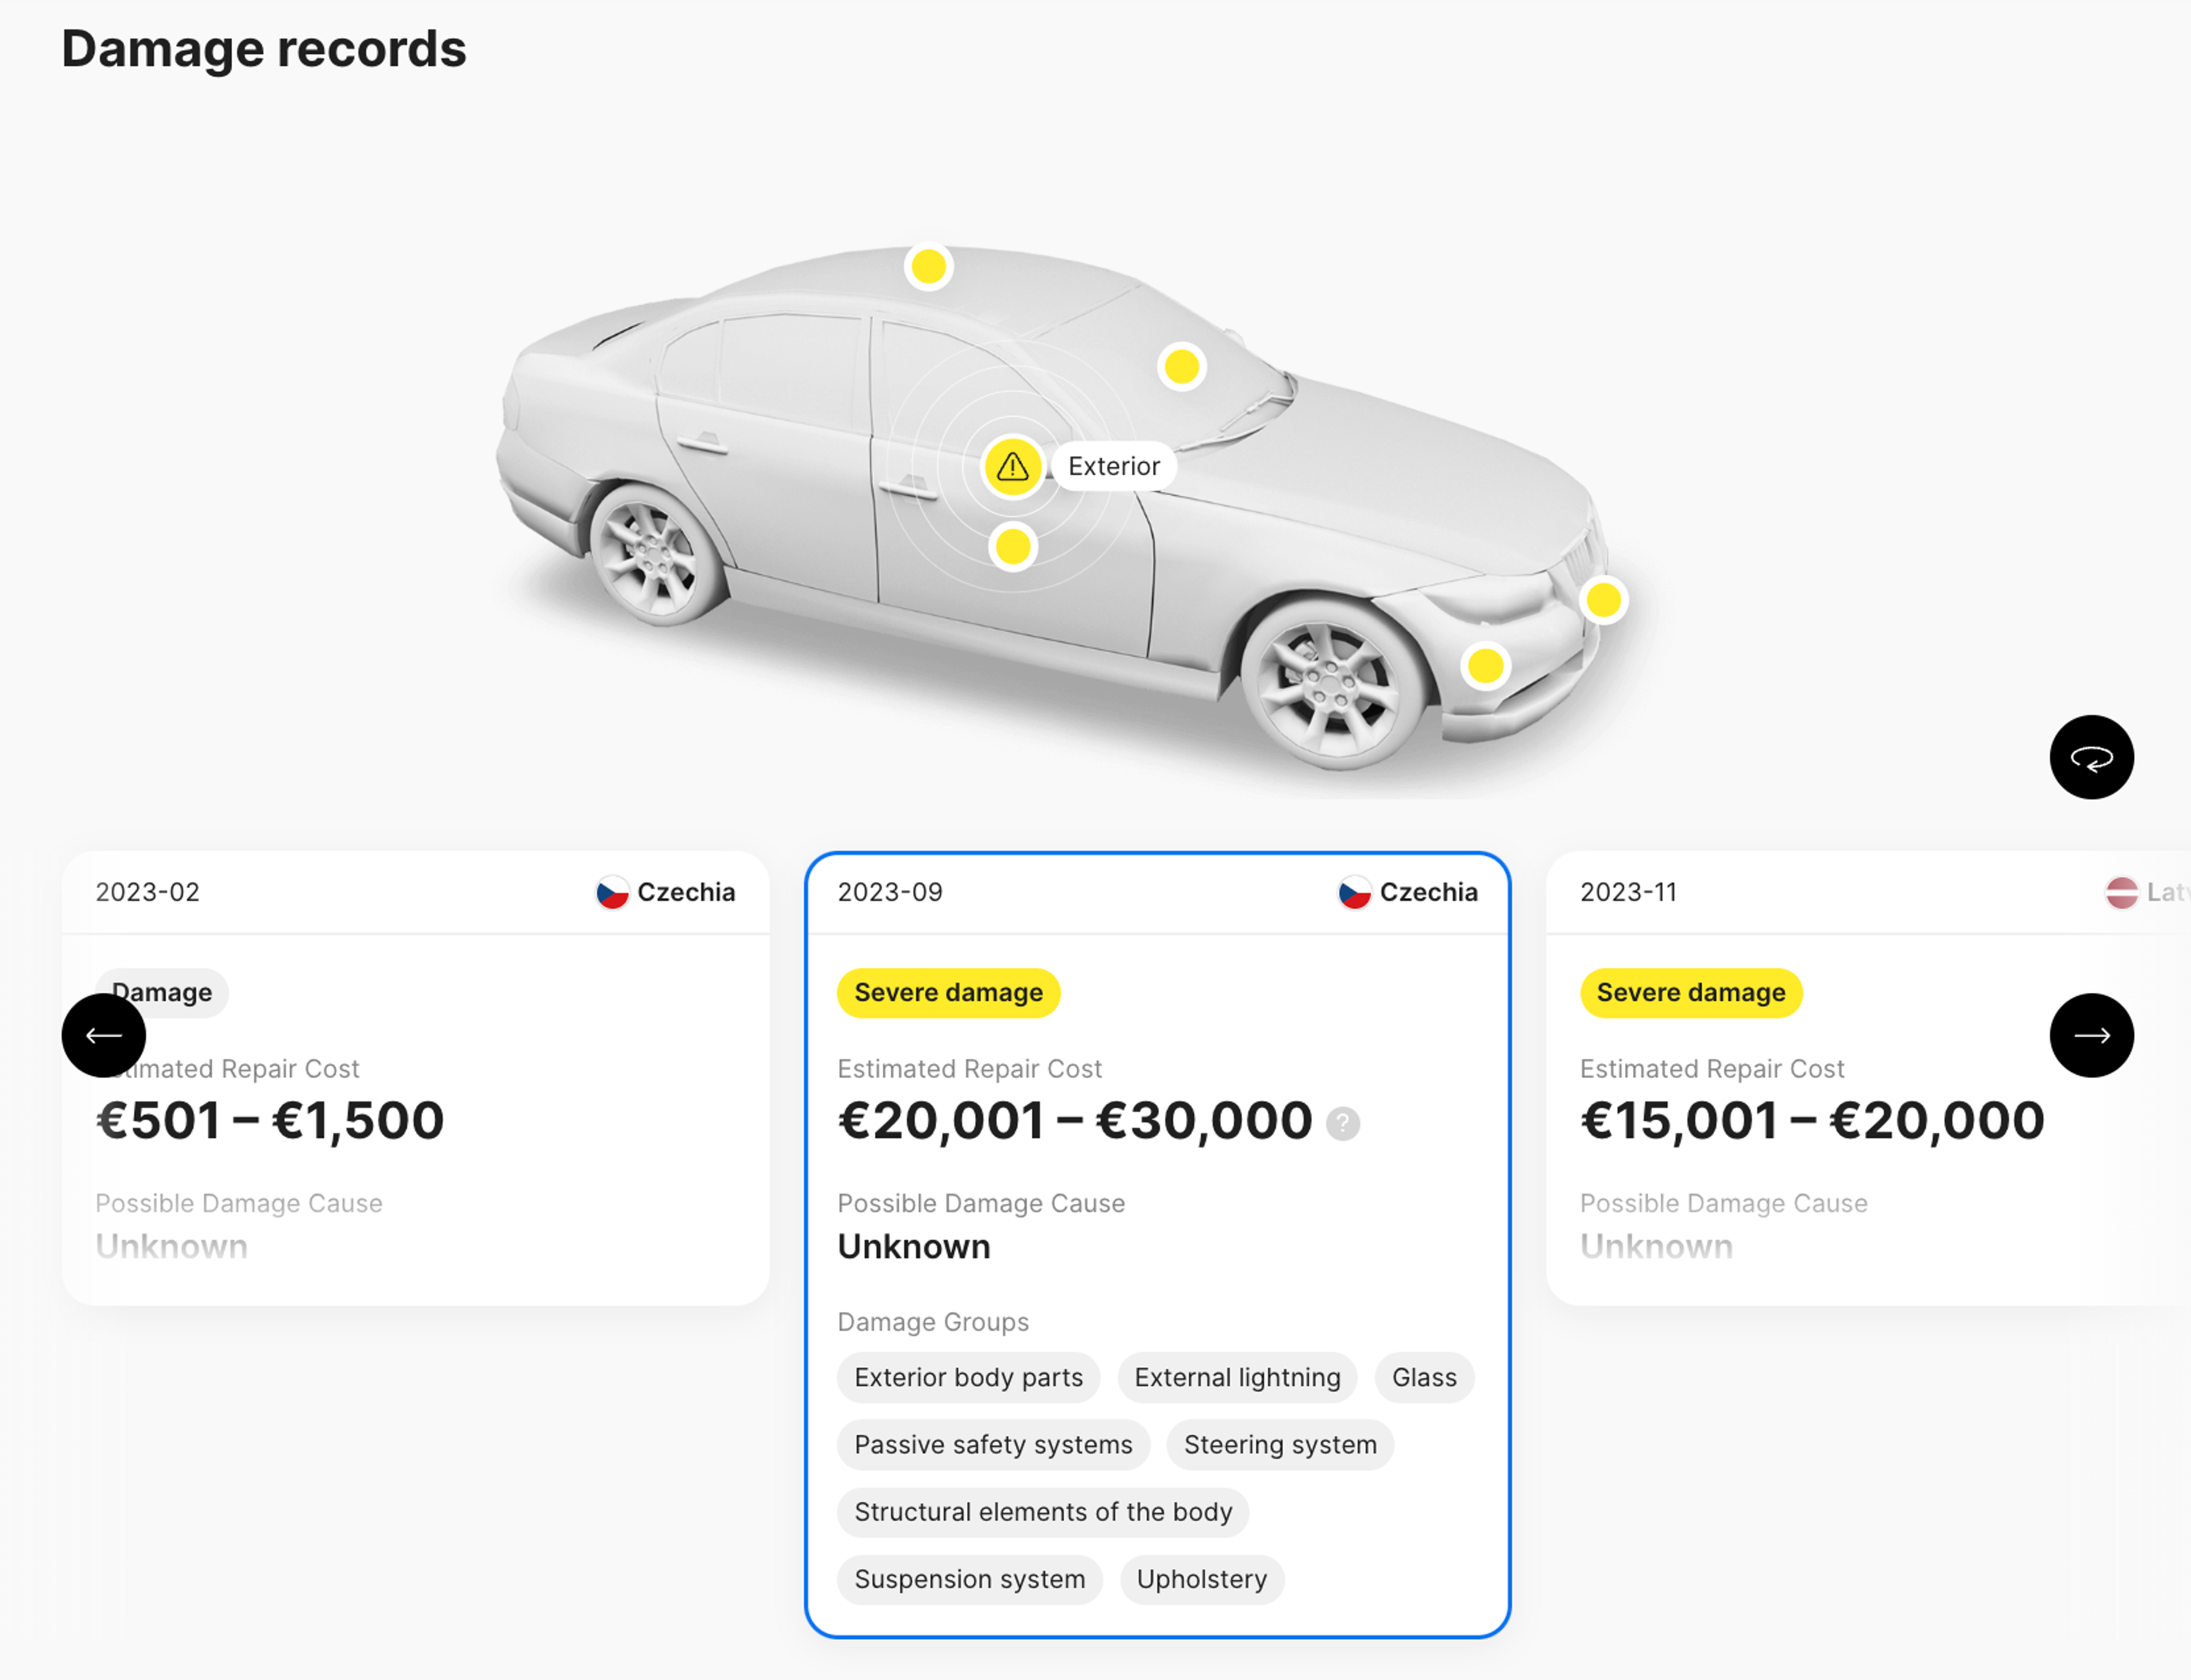
Therefore, you can gain valuable insights into the car’s condition even before meeting the seller or taking the car to a professional mechanic.
Once you’re there, use the facts you have to your advantage – ask questions and shed some light on issues that concern you. This will help you mitigate the risks associated with concealed damage and make more informed decisions when purchasing a used car.

Article by
Renata Liubertaitė
Renata is a writer with over 8 years of experience in publishing, marketing, and SaaS companies. Writing in various fields and covering highly technical topics has taught her to turn complex things into something everyone can understand. When not writing for carVertical, she loves DIY projects and spontaneous bike rides.
