25/10/2023
carVertical’s Market Transparency Index for 2023: which countries are the riskiest for used car buyers?

Anyone who has ever searched for a used car knows how frustrating it can be to find one with a clean history. Yet the used car market varies from country to country – some markets are simply more transparent than others.
Meet the 2023 Market Transparency Index!
For the second year in a row, our team has analyzed the market transparency metrics in different European countries, creating a ranking. Let's have a look at how the second-hand vehicle market is evolving and what the current trends are.

Used cars have dark secrets
Reveal them all! Just enter a VIN code and click the button:
Western European and Scandinavian countries have less fraud

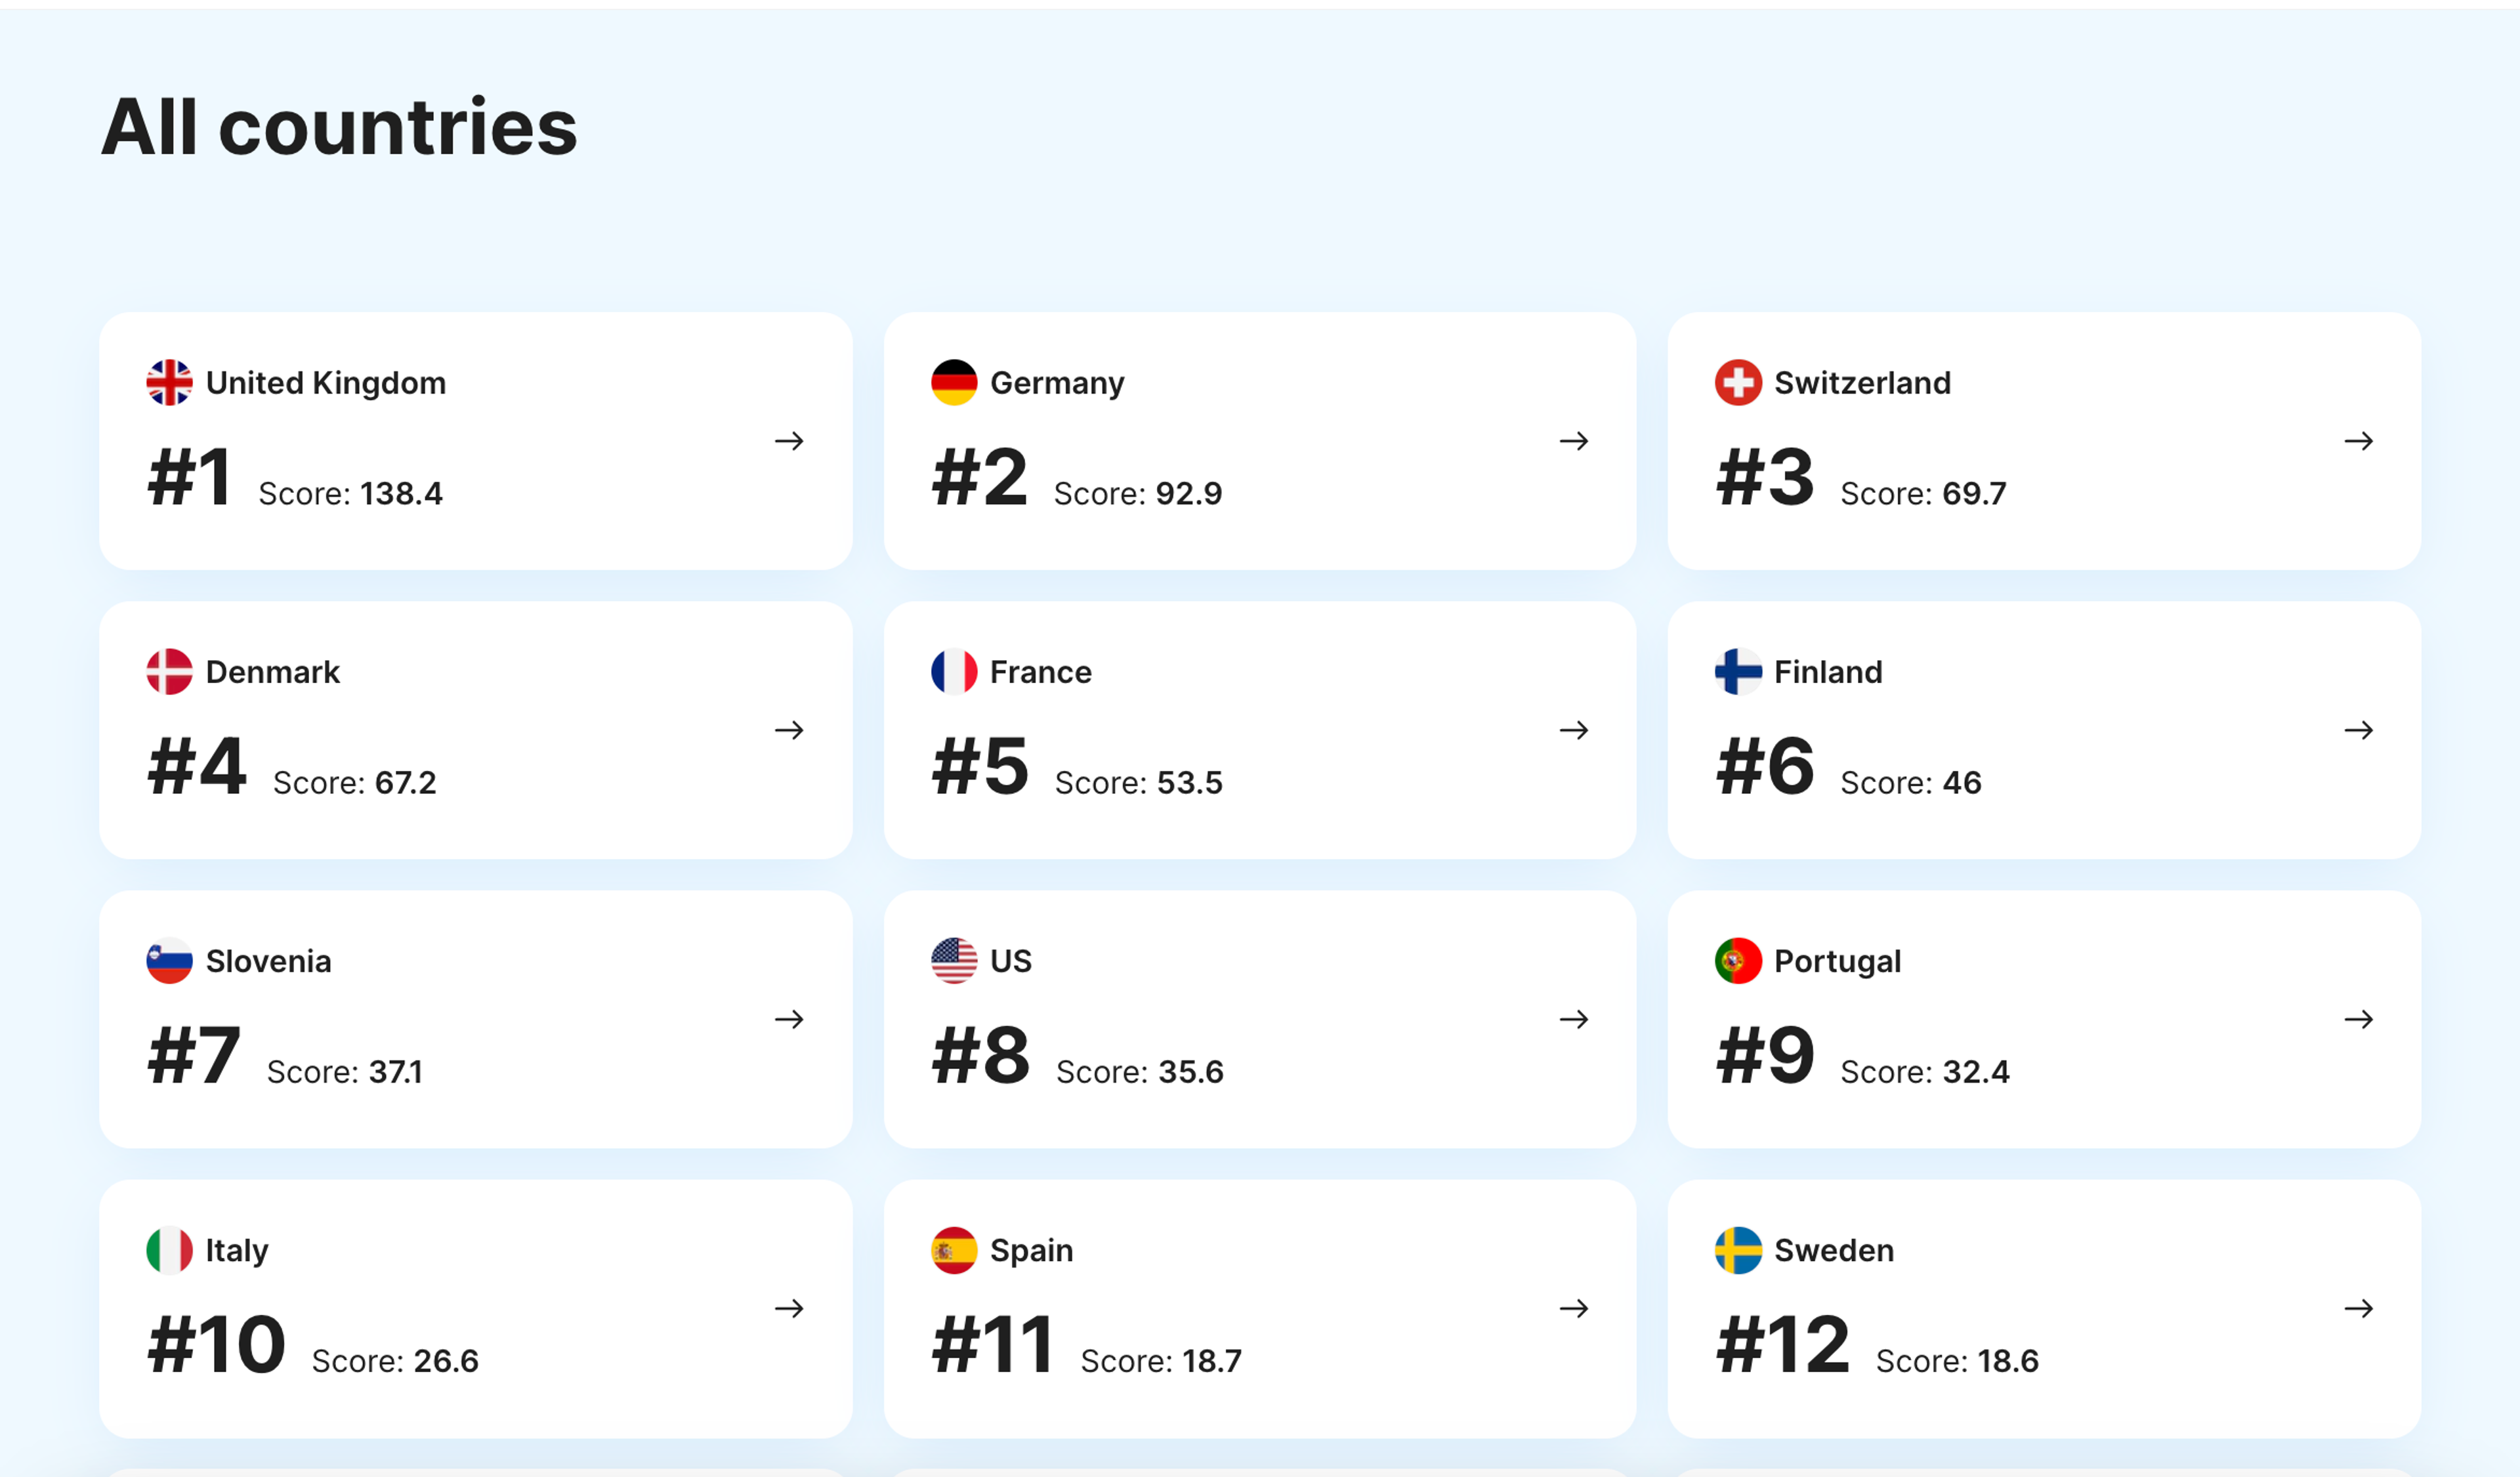
The UK is the most transparent used car market for the second year in a row. Since the British aren’t interested in left-handed cars dominating continental Europe, the import rates are very low (2.2%), directly correlating with the lower number of scams in the used car market.
The higher the import rates are, the more opportunity for scams to occur in that particular country.
In the UK, 2.7% of cars have mileage rollbacks, Germany – 3.4%, Switzerland – 2.4%, Denmark – 4.1%, and France – 3.3%, which is significantly better than in other parts of Europe. Lower clocking rates across different markets was caused by improved data accuracy and additional measures implemented to eliminate errors during data digitization.
You may wonder why mileage rollbacks in Western Europe and Scandinavian countries are less common. Apart from lower import rates, these countries also have stricter legislation and higher GDP per capita. Buyers choose newer cars over cheap ones, which results in fewer scams and mileage rollbacks.
Germany was ranked 2nd in the 2022 Market Transparency Index and it stayed in the same place this year. France and Denmark were also in the top 5 and secured their positions among the most transparent markets again this year.
Italy, which was 3rd last year, has dropped quite significantly, finishing 10th. This was caused by increased average rollback value (50,305 km in 2022 and 78,658 km this year) and average damage value (€5,928 last year compared to €7,643 in 2023). When it comes to odometer fraud, Italy has dropped from 8th place in the ranking last year to 13th this year.
Italy was replaced by Switzerland, which was only 9th last year.
While the situation in Western Europe and Scandinavia is better than in Eastern Europe, this doesn’t mean that buyers should be careless. In the UK, 18.4% of vehicles checked on carVertical had been damaged at some point, suggesting they may have hidden defects. While Germany (22.8%) and Denmark (22.8%) are not very far from the UK, the situation in France (41.2%) and Switzerland (58.9%) is far worse.
Even though Switzerland has quite a significant percentage of damages, the country is ranked 2nd by percentage of odometers clocked and 3rd by average rollback value, which allows it to be one of the most transparent countries.
Transparency in Central Europe is average
Countries from Central Europe stand in the middle of the Market Transparency Index: clocking here is more common than in Western Europe and import rates are high.
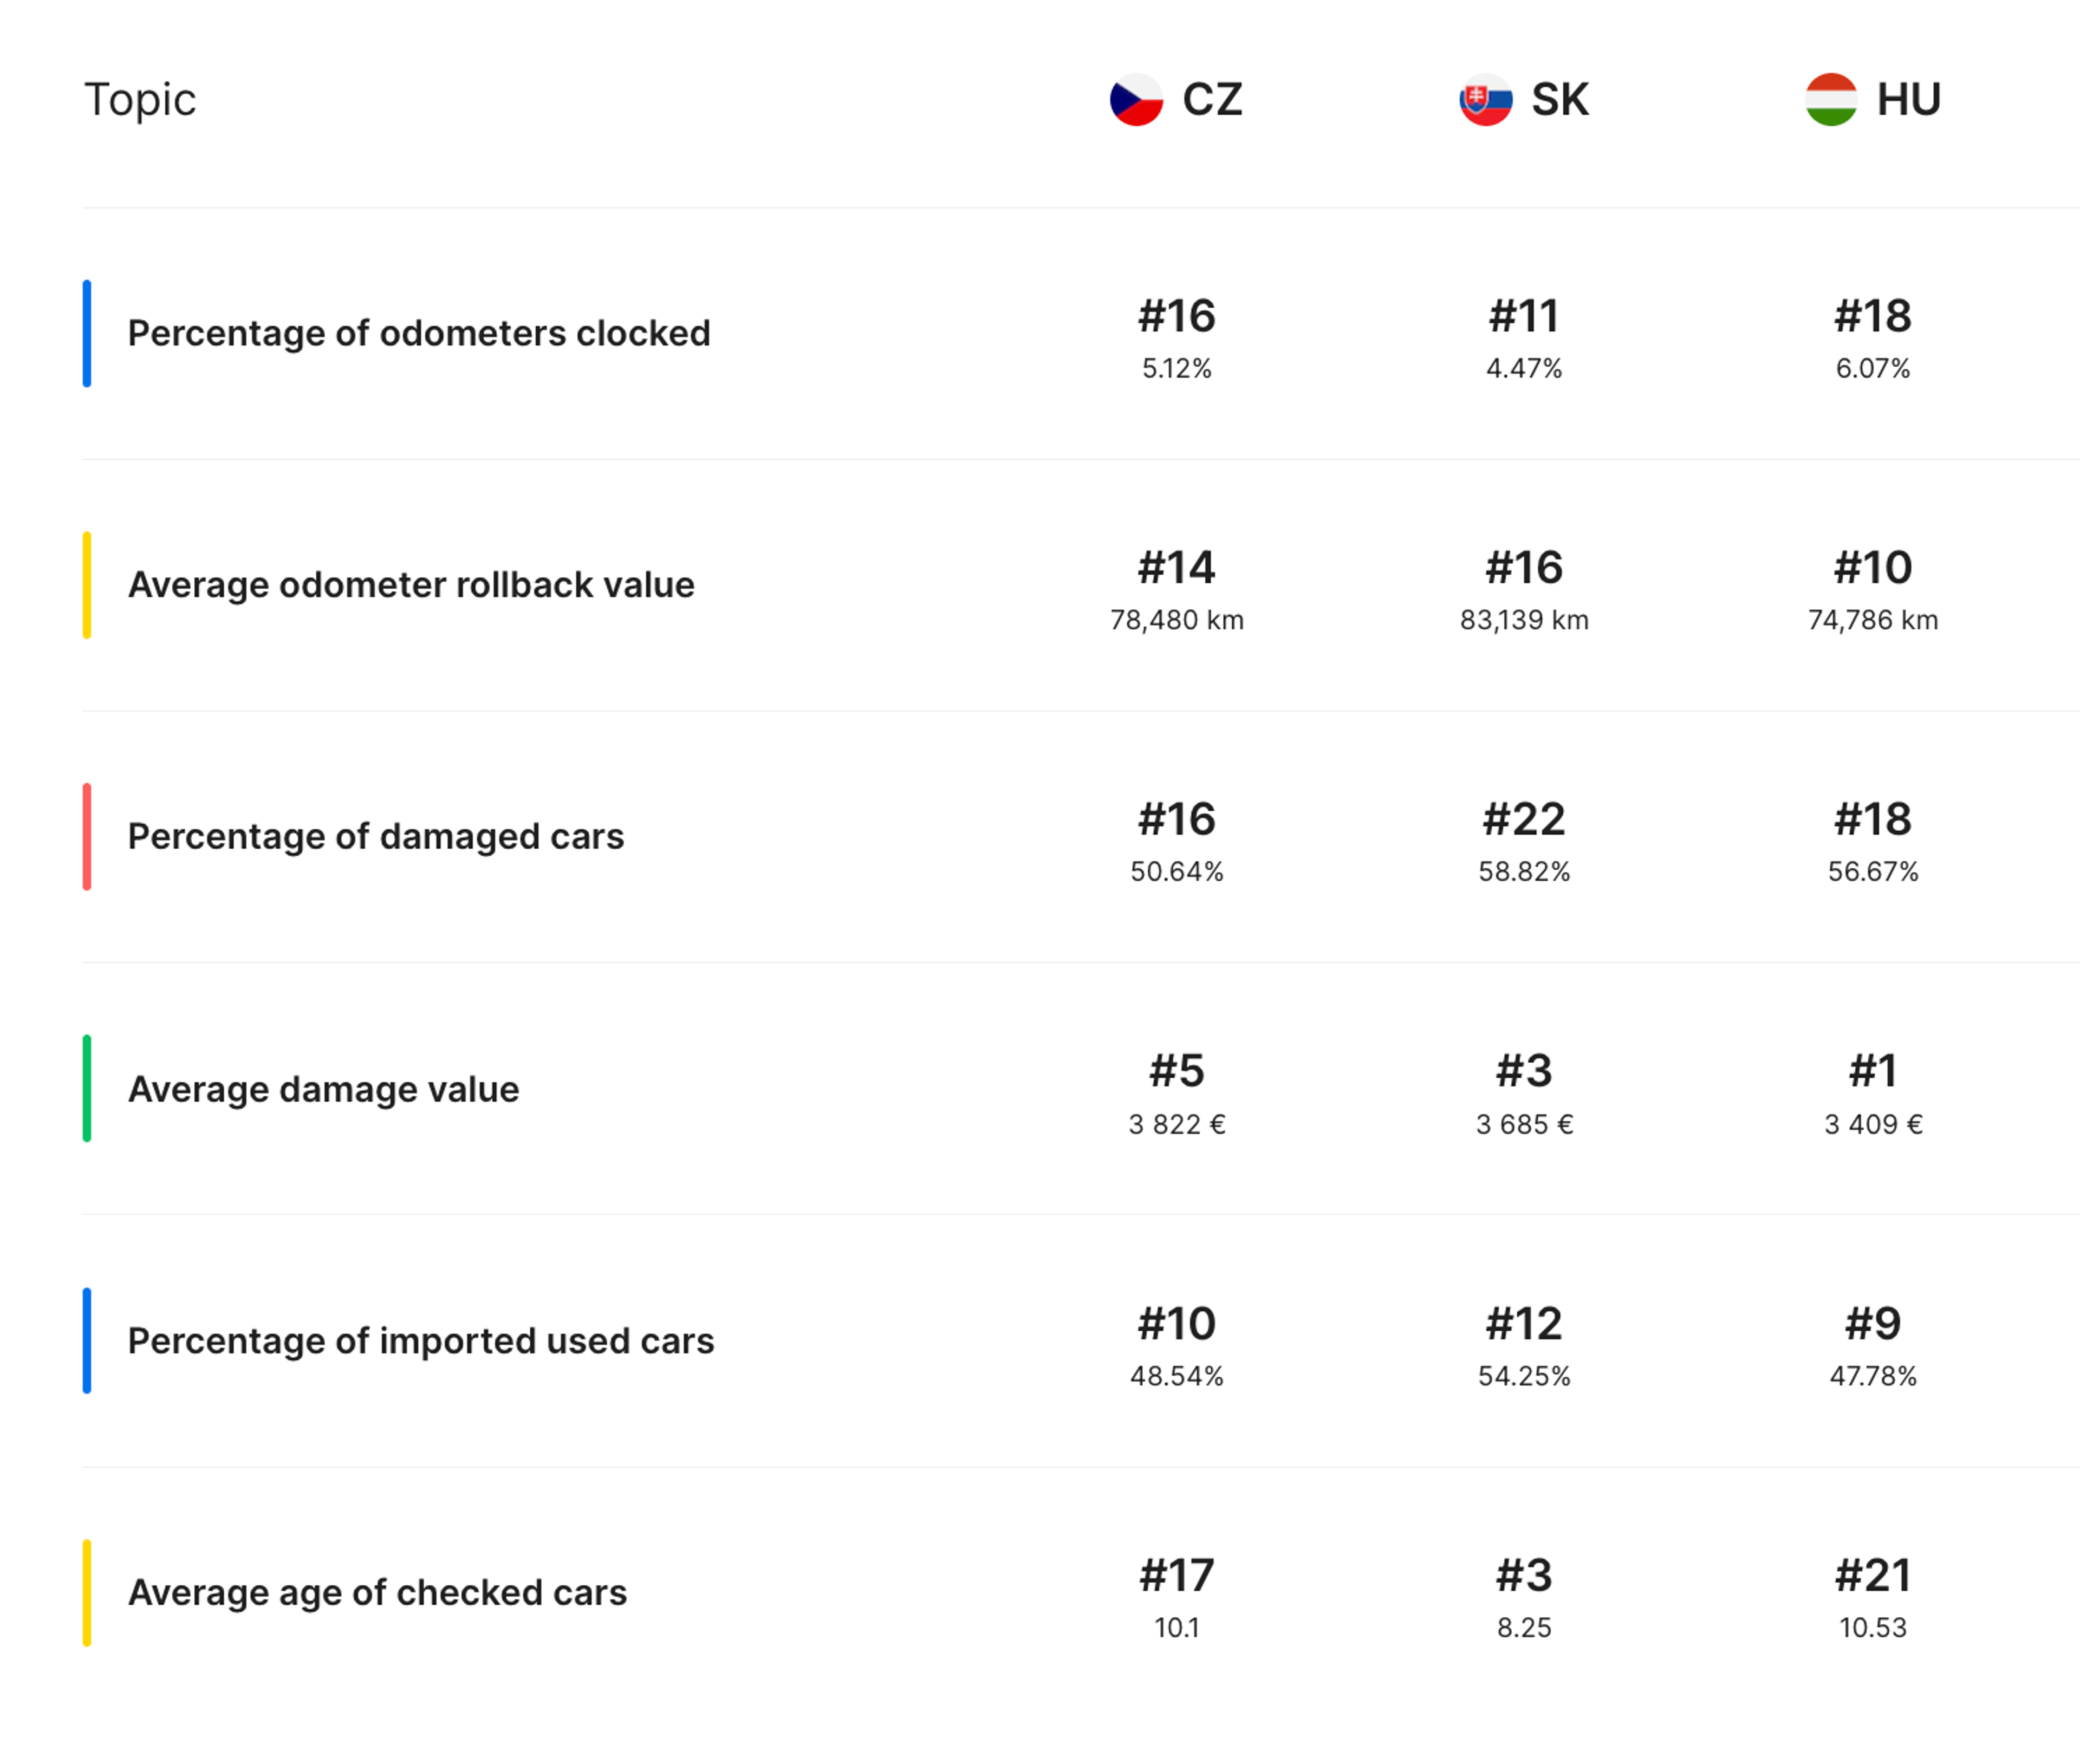
Out of 25 countries in the Transparency Index, Czechia ranks 13th, Slovakia – 14th, and Hungary – 17th. All of these countries have suffered a decline in the ranking compared to the previous year: Czechia was 12th, Slovakia – 13th, and Hungary – 14th. This slight drop in ranking may lead to millions of euros lost to scammers.
In 2022, 55% of cars in Hungary were damaged, this year, the percentage grew to 56.7%. Slovakia has experienced a similar trend: from 57.7% last year to 58.8% this year. Only Czechia managed to go from 51.6% to 50.6% and slightly improve in the damage statistics.

Eastern Europe – the cradle of fraud
Like last year, the market transparency in Eastern European countries is the worst. Fraud rates in this region correlate with a higher number of imported cars, as car data often gets lost during cross-border transactions. The share of damaged vehicles is also higher than average. Also, from the fraud prevention legislation point of view, some countries don’t do enough to protect the public interest.
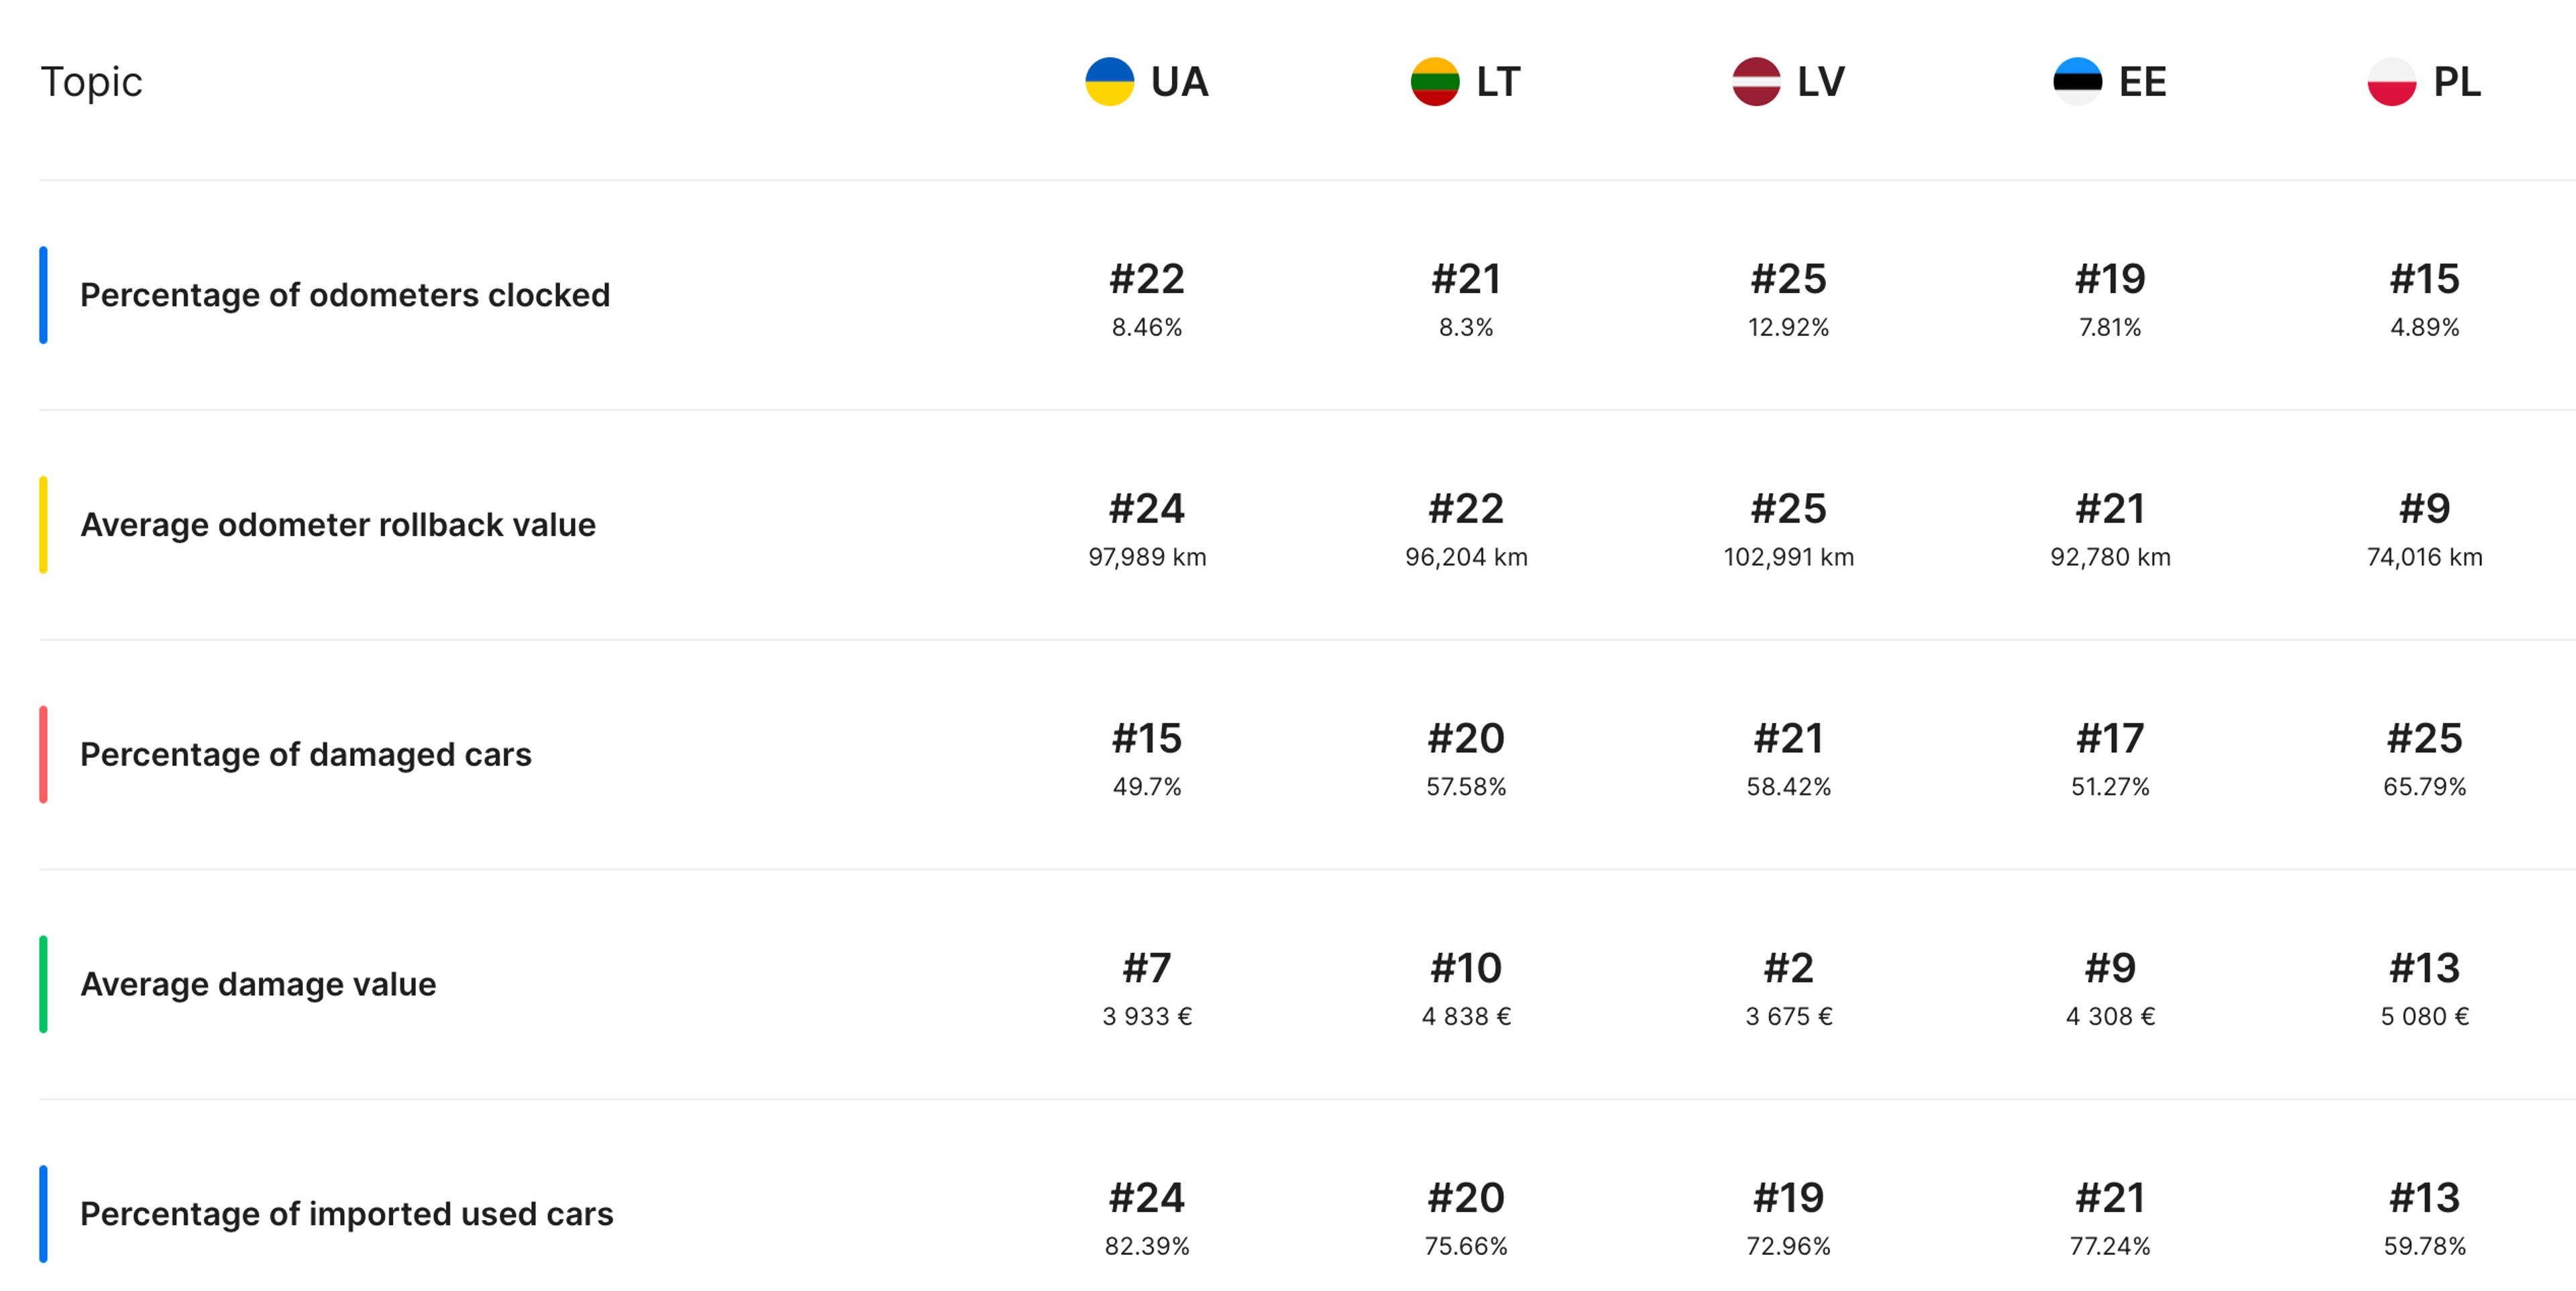
Ukraine faces transparency issues, as 8.5% of cars had been clocked and 49.7% were damaged. Last year, Ukraine was ahead of Latvia in the Transparency Index, which was the least transparent country. This year, they switched places and Ukraine took over the spot of the most shady market.
However, Latvia has the biggest share of clocked cars in the ranking – 12.9%, meaning that 1 out 8 vehicles in the country has had their odometers altered.
Lithuania remains the 3rd least transparent market, with 8.3% clocked cars and 57.6% of damaged vehicles.

While Belgium is the country with the highest import rate in the Transparency Index (85.8%), Eastern European countries follow: Ukraine – 82.4%, Bulgaria – 79.2%, Serbia – 79.2%, Estonia – 77.2%, and Lithuania – 75.7%. For comparison, Czechia, ranked 10th, has 48.5% of imported vehicles. And there are 9 other countries on the Transparency Index with an even lower share of imports.
The data shows that the transparency in certain markets has improved, and yet fraud is still prevalent everywhere, from Lisbon to Kyiv.
Methodology behind the Market Transparency Index
Our research relies on data from actual car reports bought by customers from October 2022 to September 2023.
The Market Transparency Index rates national markets based on 6 factors:
- percentage of clocked cars
- average odometer rollback value in kilometers
- percentage of damaged vehicles
- average damage value
- share of imported used cars
- average age of cars checked
Since their predicted impact on market transparency may differ, carVertical data experts assigned these factors different values. For example, the percentage of clocked cars is more important than the average age of checked vehicles in that particular country on carVertical.
In the past, inaccuracies were present due to human input errors, flawed conversions from miles to kilometers, and insufficient quality control in governmental and private car-related databases. The company has implemented a system for distinguishing odometer fraud cases from routine errors during digitization. This allows us to provide our readers with more accurate results than ever before.
Since car buyers acquire more history reports each year, we can present you with a comprehensive overview of the second-hand vehicle market.

Check your VIN
Avoid costly problems by checking a vehicle's history. Get a report instantly!
