10/16/2024
carVertical’s Market Transparency Index 2024: the riskiest countries for used car buyers revealed

The used car market is in constant flux, therefore a lot of things can happen in a few months or a year. However, the situation in different countries varies, and every market has its peculiarities.
The Market Transparency Index is our annual study conducted in 25 countries to determine the level of transparency in their second-hand vehicle markets. We ranked each country and analyzed current market trends by using the following metrics:
- Percentage of odometers with falsified readings
- Average falsified mileage (in kilometers)
- Percentage of damaged cars
- Relative damage amount
- Percentage of imported used cars
- Average age of checked cars
These metrics are essential for understanding market transparency, as they indicate the level of risk for buyers of used cars. The higher these figures are, the lower the level of transparency in the market.
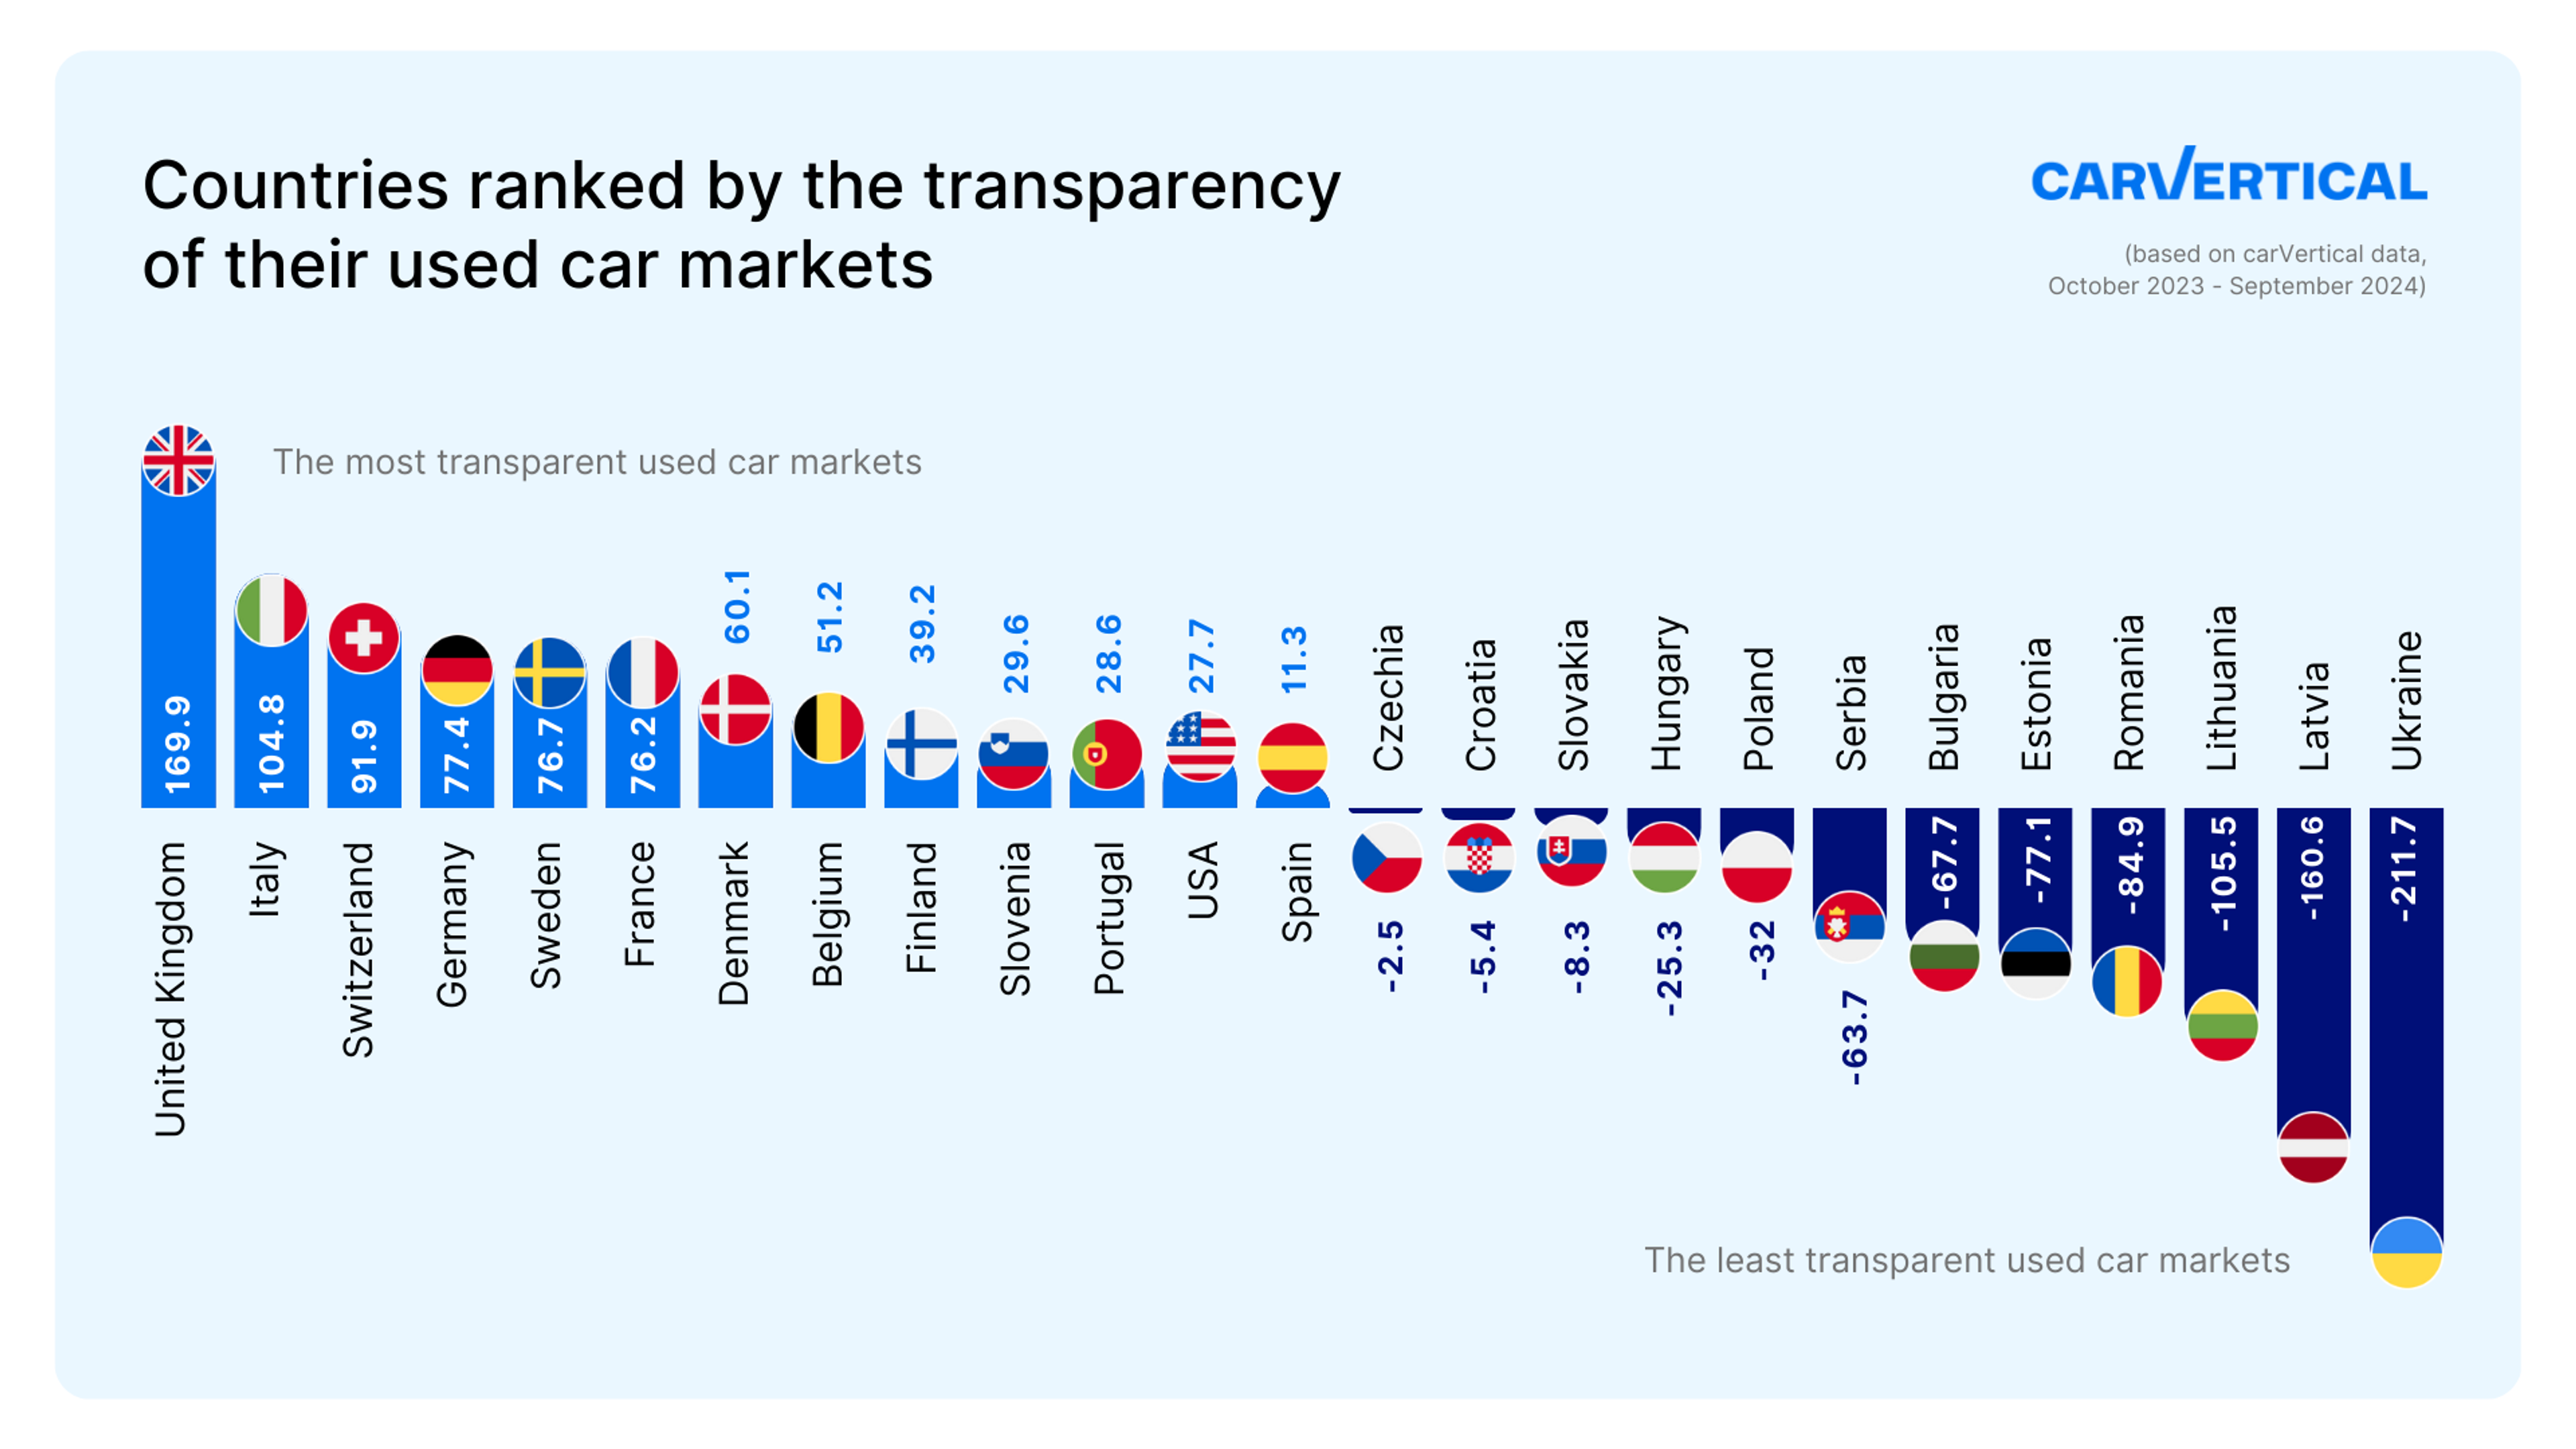
Here are the most (and least) transparent used car markets in Europe.

Need help buying a used car?
Enter a VIN code to learn more about any vehicle!
The UK maintains its position as the most transparent market

As in previous years, the UK remains the most transparent used car market among all the countries in our research. Only 2.1% of cars in the UK had falsified mileage, and 17.8% of vehicles had been damaged.
Unlike continental Europe, the UK primarily uses right-hand drive cars. As a result, only 2% of vehicles checked on carVertical in the UK were imported. Since high import rates are usually associated with higher levels of scams, the UK's peculiar position favors car buyers.
The top 5 most transparent countries also include Italy, Switzerland, Germany, and Sweden. When it comes to clocked cars, Switzerland has a share of 2.1%, followed by Germany (2.8%), Italy (3.5%), and Sweden (4.1%).
In terms of damaged cars, Italy stands out with only 12.6% of damaged cars, followed by Sweden (18.3%), Germany (23.8%), and Switzerland (55.3%).
Car buyers in Western Europe and Scandinavia are less likely to encounter mileage fraud or hidden defects. Stricter laws, newer cars, and other factors ensure that buyers can trust the vehicle’s history and quality more.
Slovenia is the only Central European country that made it to the top 10, which only proves how wide the gap is between different regions in the continent.
Car clocking and hidden damages are still prevalent in Eastern Europe
The least transparent countries in the study were Ukraine, Latvia, Lithuania, Romania, and Estonia. These markets also ranked lowest last year. A high proportion of cars with falsified mileage and damages, an aging vehicle fleet, and significant import rates contribute to these markets being considered highly non-transparent and risky.
Since scammers are rarely penalized for falsifying mileage or hiding defects, this harmful practice is likely to persist for a long time.
The highest number of mileage fraud cases among European countries was recorded in Latvia (11.1%) and Ukraine (9.6%). The largest proportion of damaged cars was found in Poland (62.1%), and Slovakia (60.5%).
Eastern European consumers typically have lower purchasing power compared to those in Western Europe. As a result, there’s a high demand for cheaper, used cars rather than new ones. Importers and dealers take advantage of this demand by bringing in older or more damaged vehicles from wealthier European countries and selling them at lower prices.
Ukraine imports the most cars out of all countries in the research (81.1% of all vehicles arrived from abroad), followed by Serbia (77,6%), Bulgaria (77,4%), Estonia (73,3%), and Latvia (69.8%).
While typically buyers in Eastern European countries are more interested in older vehicles, surprisingly, the highest average age of cars checked on carVertical was in Finland – 13.7 years. Lithuania takes the 2nd spot with 12.1 years, followed by the US – 11.1 years.
Central Europe: a midpoint between transparency and risk in the used car market
Central European countries like Slovakia, Hungary, and Czechia were always somewhere in the middle between Western and Eastern European countries. Local markets are far from transparent but the situation is still not as bad as in the Baltics or Balkans.
Among Central European countries, the situation in Slovenia is the best, with 3.7% of clocked vehicles and 30.66% damaged. This allowed the country to rank 7th this year – the same position as last year.
Czechia ranked 14th (4.3% of clocked vehicles and 52.1% damaged), Slovakia came in at 16 (3.1% clocked and 60.5% damaged) and Hungary – 17th (5.4% clocked and 54.9% damaged). Hungary maintained its position from 2023, while Slovakia lost 2 positions.
Compared to Western Europe, the average consumer in Central Europe has less purchasing power and tends to buy used cars instead of new ones. This demand for cheaper vehicles creates a market for older, potentially damaged, or odometer-tampered cars, so buyers should be cautious when picking their next ride to avoid common mistakes.
42.5% of cars in Czechia were imported from abroad, in Slovakia – 49.2%, and in Hungary – 45%. However, import market share in Central Europe is lower than in Eastern Europe, suggesting why these countries rank higher.
Buying in a risky market? Use carVertical to avoid issues
We can’t choose the level of transparency in our countries, but we can do a lot more to ensure we’re not buying blind. Start by getting a carVertical report!
Our vehicle history reports can give you a lot of useful information about a car’s past:
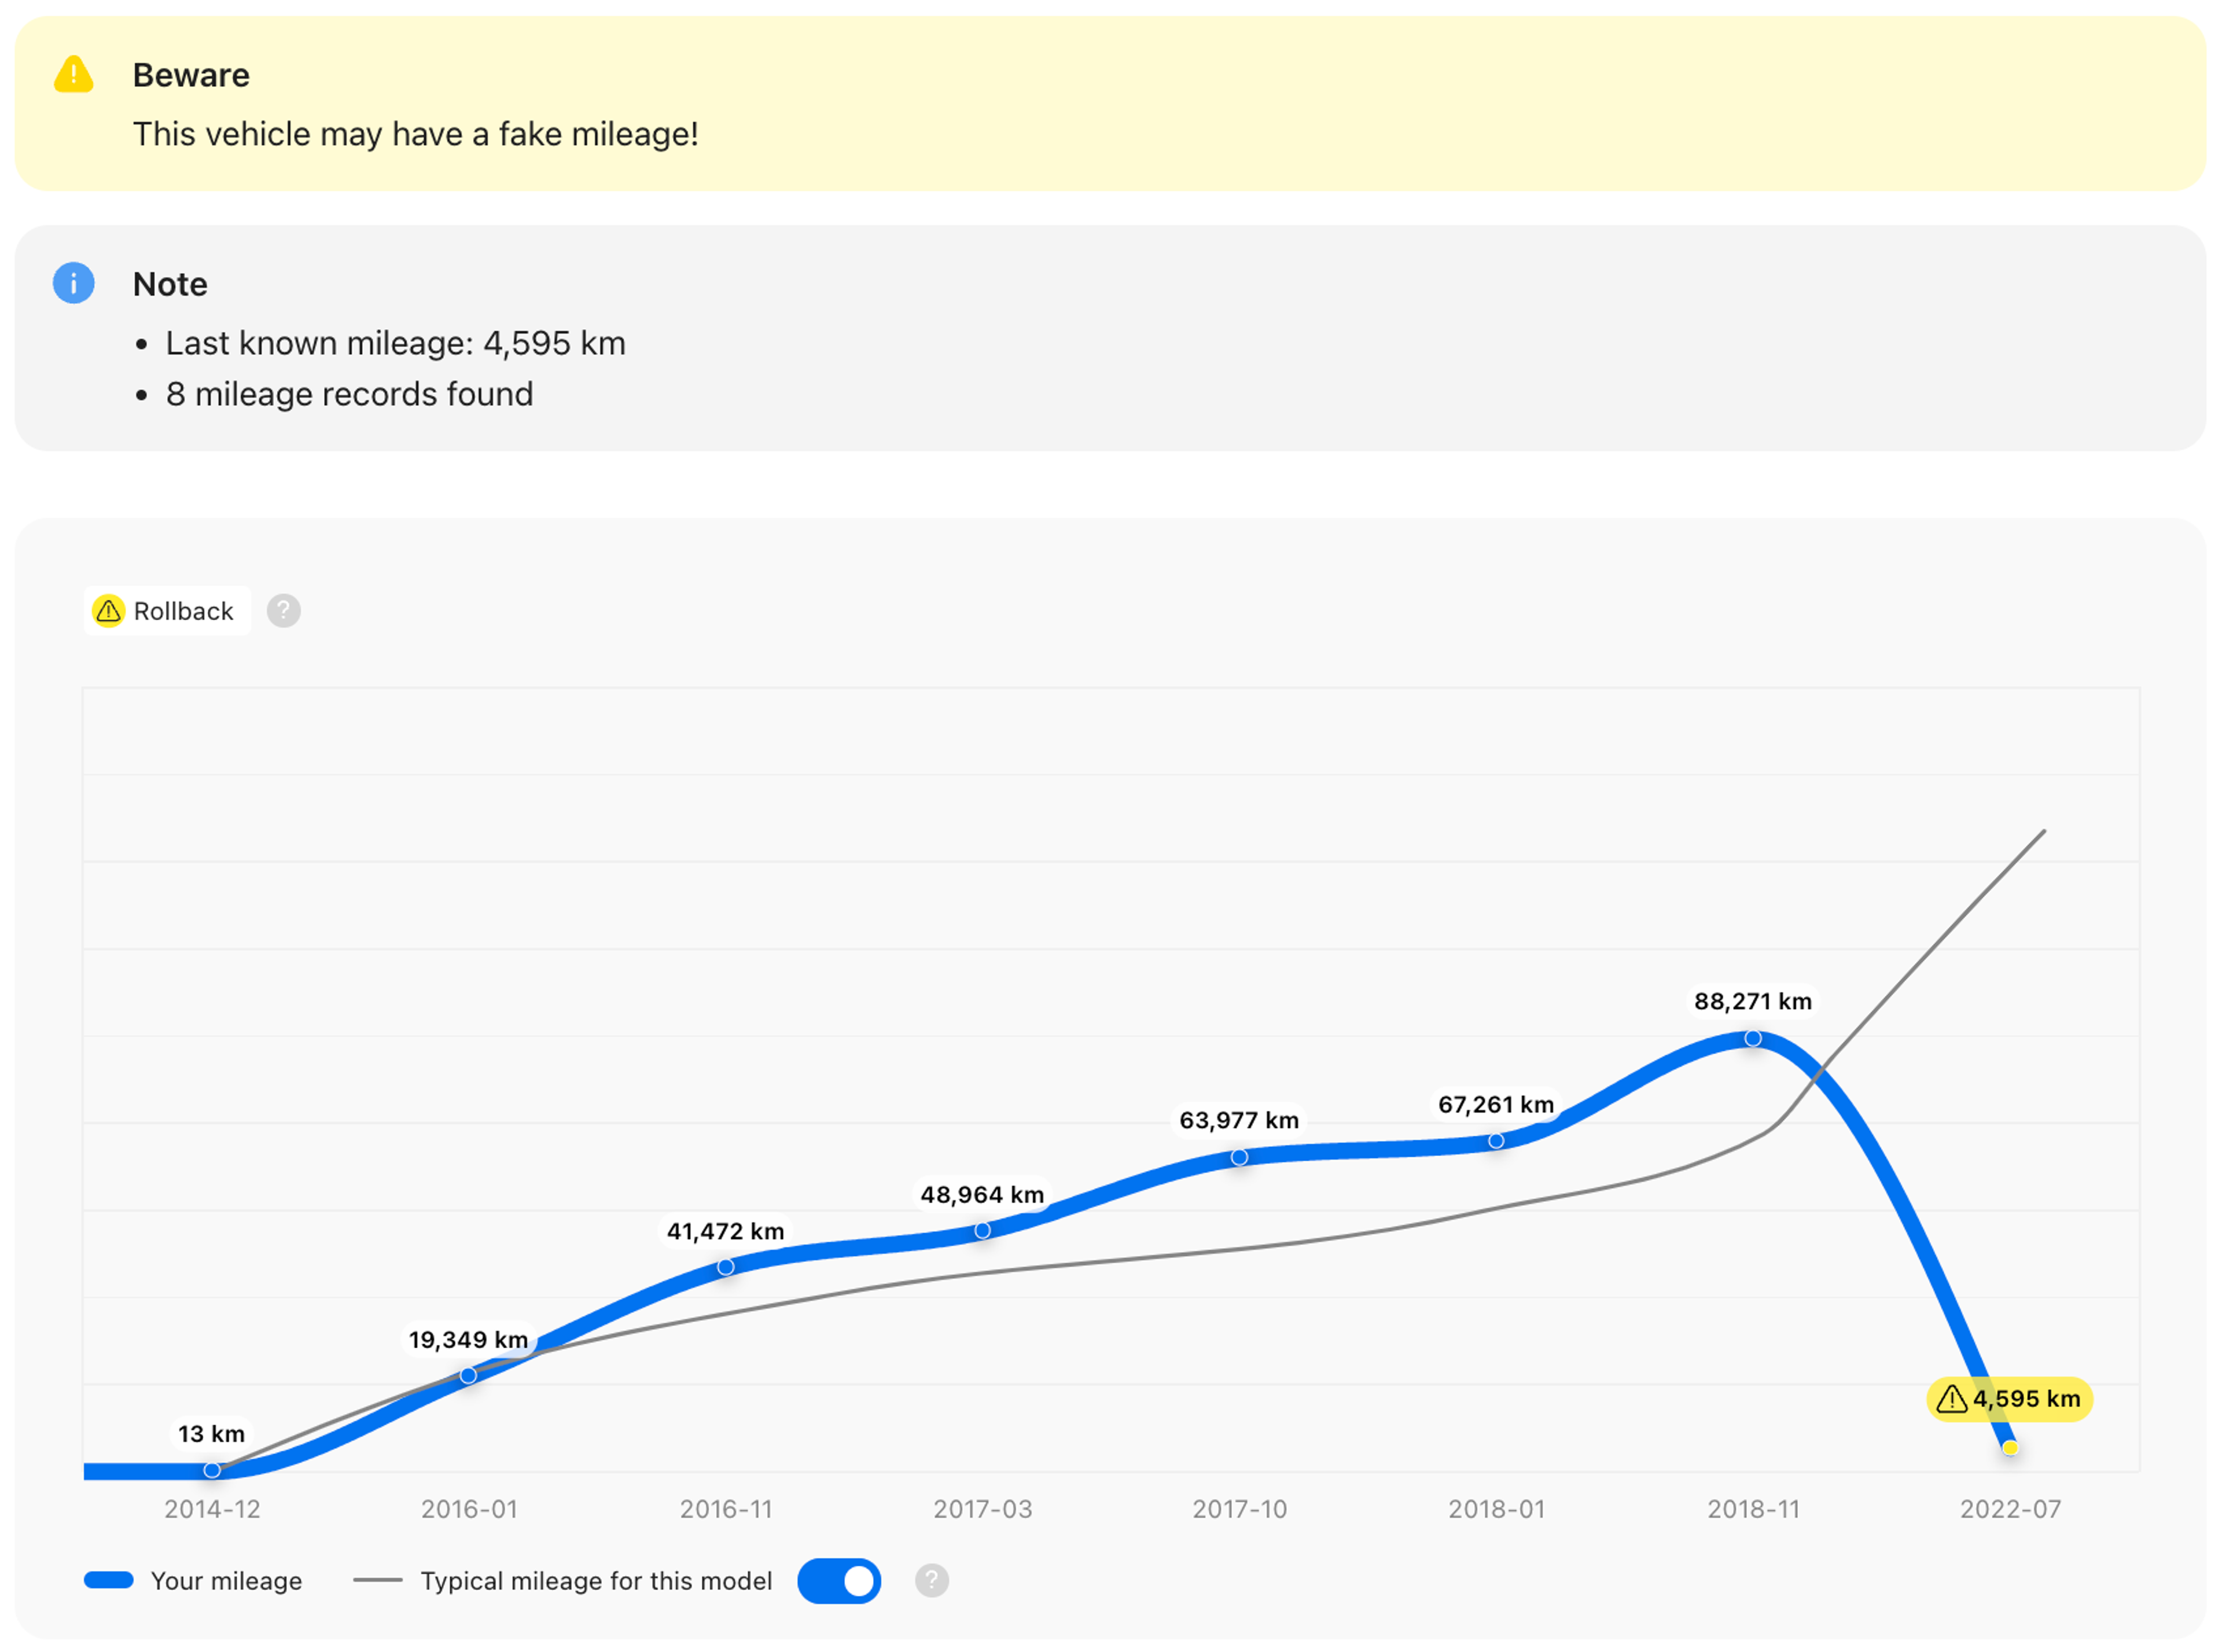
- Mileage history (and possible odometer rollbacks)
- Damage history
- Thefts
- Ownership changes
- Countries of registration
… and a lot more.

Knowing the history of a vehicle will help you avoid bad deals whether the market is transparent or not. Damages, mileage rollbacks, and other issues will end up costing unsuspecting users a lot more than a report would.

Check your VIN
Avoid costly problems by checking a vehicle's history. Get a report instantly!
How was the Market Transparency Index calculated?
Our study analyzed vehicle history reports purchased by the company's users between October 2023 and September 2024. The Market Transparency Index was derived using six indicators:
- Percentage of odometers with falsified readings
- Average falsified mileage (in kilometers)
- Percentage of damaged cars
- Relative damage amount
- Percentage of imported used cars
- Average age of checked cars
Since these criteria do not equally impact market transparency, different weights were assigned to each factor. For instance, how many kilometers the odometer was falsified is considered more important than the average age of checked cars in a given country.
You can find the full report here: carVertical Transparency Index.
